
Thursday, April 17, 2014 From rOpenSci (https://ropensci.org/blog/2014/04/17/plotly/). Except where otherwise noted, content on this site is licensed under the CC-BY license.
Editor’s note: This is a guest post by Matt Sundquist from Plot.ly.
Ggplotly and Plotly’s R API let you make ggplot2 plots, add py$ggplotly(), and make your plots interactive, online, and drawn with D3. Let’s make some.
🔗 1. Getting Started and Examples
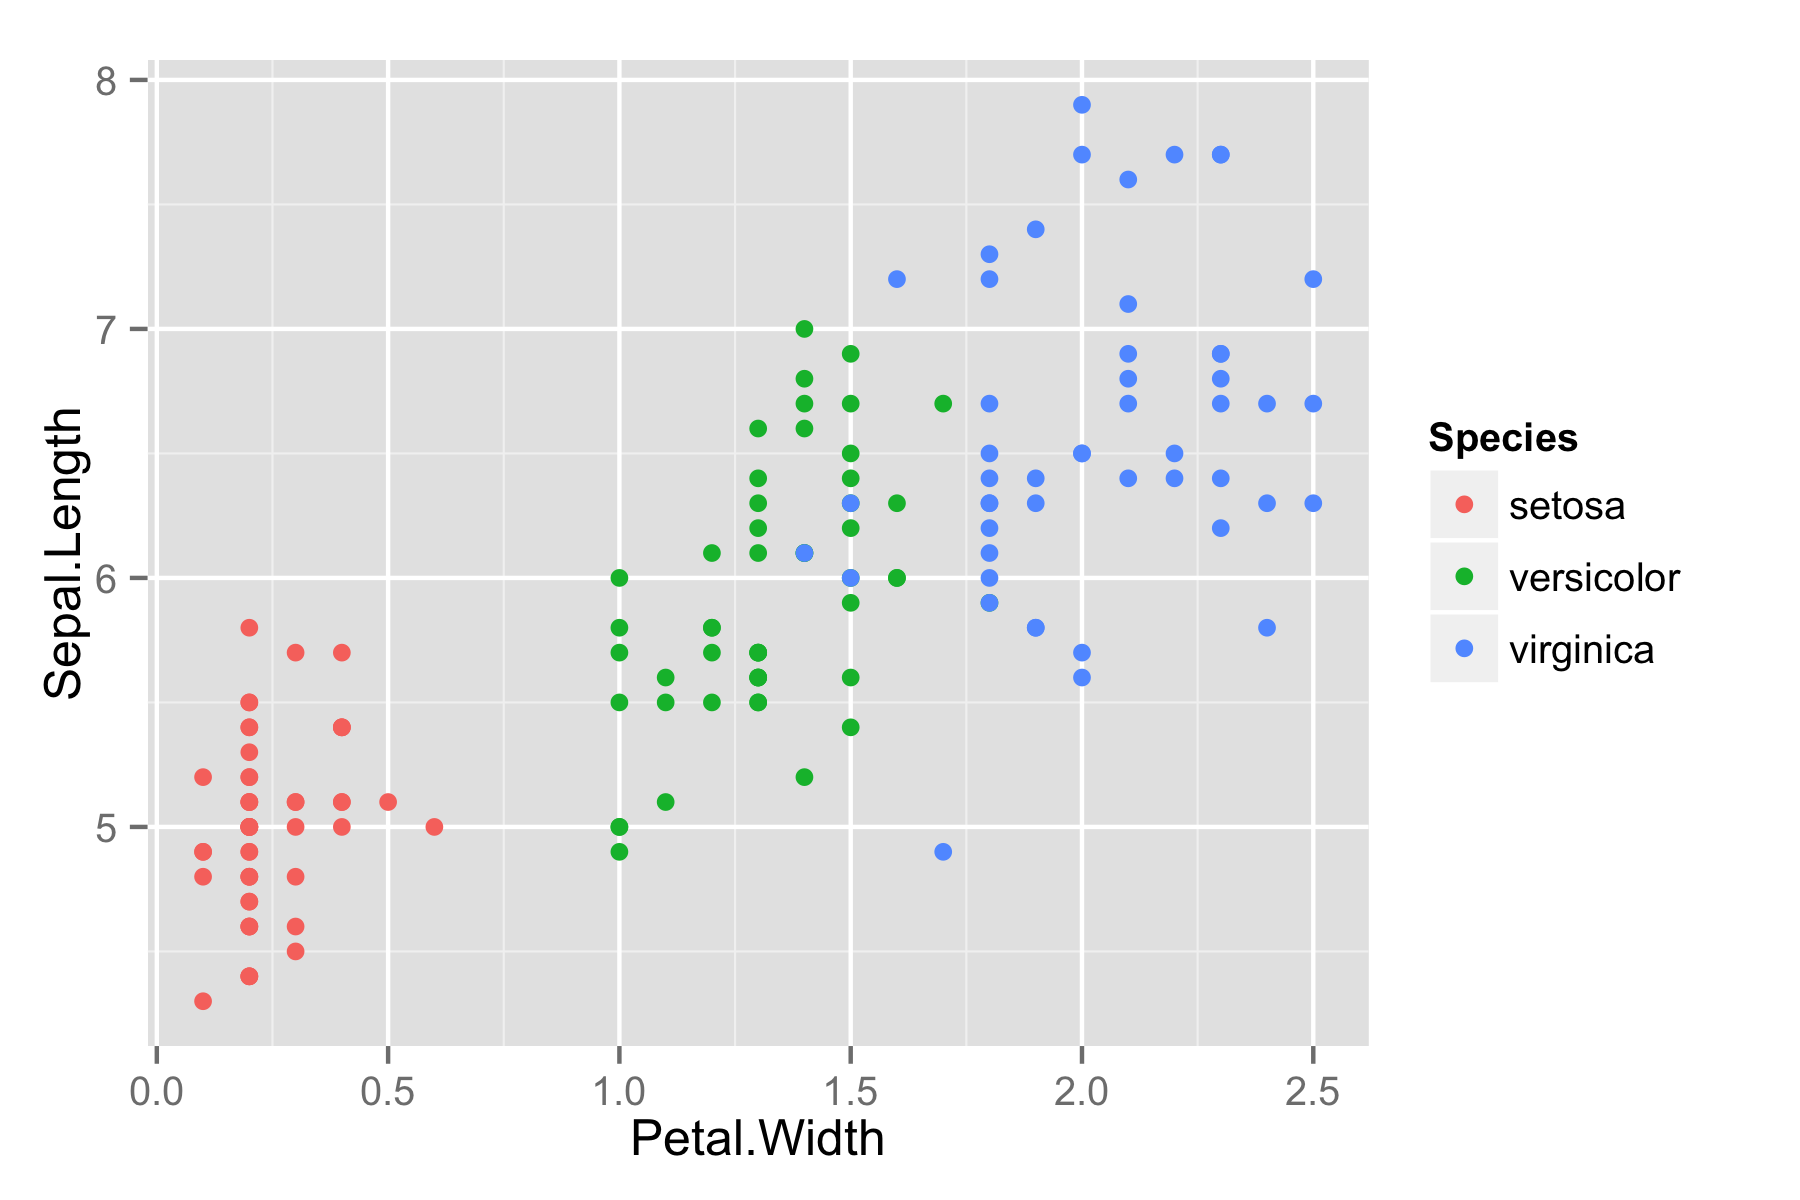
Here is Fisher’s iris data.
library("ggplot2")
ggiris <- qplot(Petal.Width, Sepal.Length, data = iris, color = Species)
print(ggiris)
Let’s make it in Plotly. Install:
install.packages("devtools")
library("devtools")
install_github("plotly", "ropensci")
Load.
library("plotly")
## Loading required package: RCurl
## Loading required package: bitops
## Loading required package: RJSONIO
Sign up online, use our public keys below, or sign up like this:
signup("new_username", "[email protected]")
That should have responded with your new key. Use that to create a plotly interface object, or use ours:
py <- plotly("RgraphingAPI", "ektgzomjbx")
It just works.
py$ggplotly(ggiris)
The call opens a browser tab. Or in an .Rmd document, the plot is embedded if you specify the plotly=TRUE chunk option (see source). If you’re running this from the source, it makes all the graphs at once in your browser. Reaction my first time: here be dragons.
If you click the data and graph link in the embed, it takes you to Plotly’s GUI, where you can edit the graph, see the data, and share your plot with collaborators.
🔗 1.2 Maps
Next: Maps!
data(canada.cities, package="maps")
viz <- ggplot(canada.cities, aes(long, lat)) +
  borders(regions="canada", name="borders") +
  coord_equal() +
  geom_point(aes(text=name, size=pop), colour="red", alpha=1/2, name="cities")
Call Plotly.
py$ggplotly(viz)
🔗 1.3 Scatter
Want to make a scatter and add a smoothed conditional mean? Here’s how to do it in Plotly. For the rest of the plots, we’ll just print the Plotly version to save space. You can hover on text to get data, or click and drag across a section to zoom in.
model <- lm(mpg ~ wt + factor(cyl), data=mtcars)
grid <- with(mtcars, expand.grid(
  wt = seq(min(wt), max(wt), length = 20),
  cyl = levels(factor(cyl))
))

grid$mpg <- stats::predict(model, newdata=grid)

viz2 <- qplot(wt, mpg, data=mtcars, colour=factor(cyl)) + geom_line(data=grid)
py$ggplotly(viz2)
🔗 1.4 Lines
Or, take ggplotly for a spin with the orange dataset:
orange <- qplot(age, circumference, data = Orange, colour = Tree, geom = "line")
py$ggplotly(orange)
🔗 1.5 Alpha blend
Or, make plots beautiful.
prettyPlot <- ggplot(data=diamonds, aes(x=carat, y=price, colour=clarity))
prettyPlot <- prettyPlot + geom_point(alpha = 1/10)
py$ggplotly(prettyPlot)
🔗 1.6 Functions
Want to draw functions with a curve?
eq <- function(x) {x*x}
tmp <- data.frame(x=1:50, y=eq(1:50))

# Make plot object
p <- qplot(x, y, data=tmp, xlab="X-axis", ylab="Y-axis")
c <- stat_function(fun=eq)

py$ggplotly(p + c)
🔗 2. A GitHub for data and graphs
Like we might work together on code on GitHub or a project in a Google Doc, we can edit graphs and data together on Plotly. Here’s how it works:
- Your URL is shareable.
- Public use is free.
- You can set the privacy of your graph.
- You can edit and add to plots from our GUI or with R or APIs for Python, MATLA, Julia, Perl, Arduino, Raspberry Pi, and REST.
- You get a profile of graphs, like Rhett Allain from Wired Science.
- You can embed interactive graphs in iframes.
🔗 2.1 Inspiration and team
Plotly’s API is part of rOpenSci and being developed by the brilliant Toby Hocking and Plotly’s own Chris Parmer. You can find it on GitHub. Your thoughts, issues, and pull requests are welcome. Right now, you can make scatter and line plots; let us know what you’d like to see next.
The project was inspired by Hadley Wickham and the elegance and precision of ggplot2. Thanks to Scott Chamberlain, Joe Cheng, and Elizabeth Morrison-Wells for their help.
🔗 3. ggthemes and Plotly
Using ggthemes opens up another set of custom graph filters for styling your graphs. To get started, you’ll want to install ggthemes.
library("devtools")
install_github("ggthemes", "jrnold")
and load your data.
library("ggplot2")
library("ggthemes")
dsamp <- diamonds[sample(nrow(diamonds), 1000), ]
Inverse gray.
gray <- (qplot(carat, price, data = dsamp, colour = cut) +
           theme_igray())
py$ggplotly(gray)
The Tableau scale.
tableau <- (qplot(carat, price, data = dsamp, colour = cut) +
              theme_igray() +
              scale_colour_tableau())
py$ggplotly(tableau)
Stephen Few’s scale.
few <- (qplot(carat, price, data = dsamp, colour = cut) +
          theme_few() +
          scale_colour_few())
py$ggplotly(few)
Filed under
Suggest an edit
Open a pull request
