
Thursday, July 11, 2024 From rOpenSci (https://ropensci.org/blog/2024/07/11/collaboration-networks/). Except where otherwise noted, content on this site is licensed under the CC-BY license.
This article is based on two talks presented at CSV,Conf,V7 and LatinR in 2023.
In June 2022 I (Yani) become the rOpenSci Community Manager. To do a good job in this kind of role it is essential to know your community, so as soon I started I dug in: reading our documentation, learning our processes and their metrics, and conducting interviews with team-mates and community members.
In my previous experience working with scientific and technological communities of practice, in collaboration with Sandro, I had used a tool called Social Network Analysis to understand the interaction of the members and plan strategies around the activities. This served me well and I was looking forward to applying it to the rOpenSci community
In this blog post we present how we have used this tool with R, to better understand and manage the rOpenSci community.
🔗 Community of practice and community manager
In the context of a STEM community of practice, a community manager is someone who facilitates community activities and interactions among members. A community manager has responsibilities for tasks with technical, interpersonal, communication, program management and program development aspects.
A community of practice is a group of people who share a passion for something that they know how to do, and who interact regularly in order to learn how to do it better
– Etienne Wenger
A Community Manager facilitates the activities of a community and the interactions between community members. Community management may be considered as “in-reach” rather than “outreach” or public engagement.
– CSCCE
rOpenSci is a community of practice and our passion is to build tools, resources, and social and technical infrastructure to enable open and reproducible research using R. We interact regularly in different activities and spaces in order to learn how to do it better.
🔗 Community interactions and connectivity
rOpenSci keeps track of many metrics relating to the health and enthusiasm of our community. For example, how many packages we reviewed, how many blog posts we wrote, how many community calls we organized and how many people came. This are very useful and show us an overal idea of our community and our activities.
However, communities are built on connections, and those summaries and number don’t give us much information about the growth and strength of professional and interpersonal connections in our community.
If we understand the connectivity in our community we can plan targeted and effective interventions to:
- improve collaborations
- improve information flow
- improve knowledge reuse
- enhance knowledge (co)creation
- enhance knowledge transfer
🔗 Social Network Analysis
Here is where Social Networks Analysis comes into play. I’m not talking about Instagram or Mastodon here, I’m talking about networks of relationships among individuals or organization.
A network is a group of individuals who relate to others for a specific purpose, characterized by the existence of information flows.
By exploring these networks, we can try to answer questions for a given moment in time, for example:
- Who is connected to whom? Who is not connected?
- Where, and who, are the hubs?
- Where and about what are the clusters? Are there silos?
We can also look at how thing change over time:
- Are new connections forming?
- Are new patterns of connectivity forming?
- How did our network change with the introduction of an activity?
🔗 Basic elements and metrics
To answer these questions, we can map and explore the nodes and edges of our community network. Nodes are points or vertices and are connected to each other by edges. Together the pattern of connections makes up a network.
In our community, nodes and edges could represent individual community members and their collaborations, for example, co-writing a blog post together, or being authors on the same R package. The connection between the nodes can have a direction, for example, when a person follow another on social media.
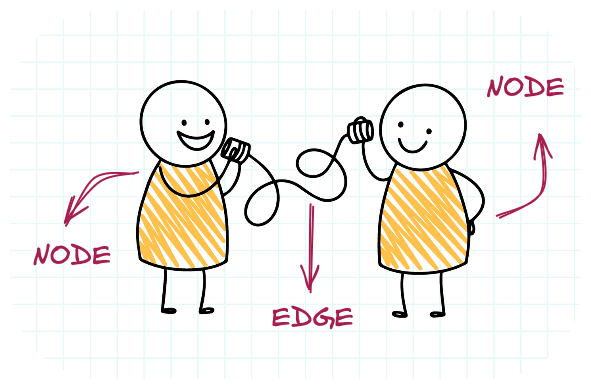
A basic network, with two nodes (community members) and an edge between them (an interaction). Image by freepik
There are several metrics that can be calculated to understand the structure of a network, for example:
The degree of a node is how many connections it has. The higher the degree, the more connected the node. For example, a community member who interacts with many different community members.
Betweenness measures the number of times a node lies on the shortest path between other nodes. This indicates which nodes are ‘bridges’ between nodes in a network. For example community members who often interact with different groups of members.
Closeness scores each node based on how close it is to all other nodes in the network. The distance is the lengths of pairwise shortest paths from a node to another node. For example, this can be useful for finding community members who are best placed to influence the entire network most quickly.
Clusters or communities are groups of nodes with a high number of connections among that. For example, community members who often work together. A clique is when all members are interconnected and a silo is when members have no connections with other clusters on the network.
🔗 Data for a network
For this type of analysis we need data that reveal connections among actors in a network.
The most common data collection methods used in social network analysis are surveys and interviews with members in the network. As you can imagine, this can be costly in time and money.
Data can also come from secondary sources, like social media connections, or from your own knowledge of the relationships that exist in the network.
So we considered, is it possible that we already have the data we need to analyze the connectivity of our community? Is it possible that we could collect this data in an automated or semi-automated way to repeat the analysis, allowing us to explore how our network changes over time?
🔗 Pathways to contributing at rOpenSci
Fortunately at rOpenSci we have a Contributing Guide, there is a whole book describing the different ways you can contribute to the community (check our Tip Sheet for a summary). For example, you can, Write a blog post, Review a package, Maintain a package, Speak at a Community Call, Become a champion or Host a coworking session.
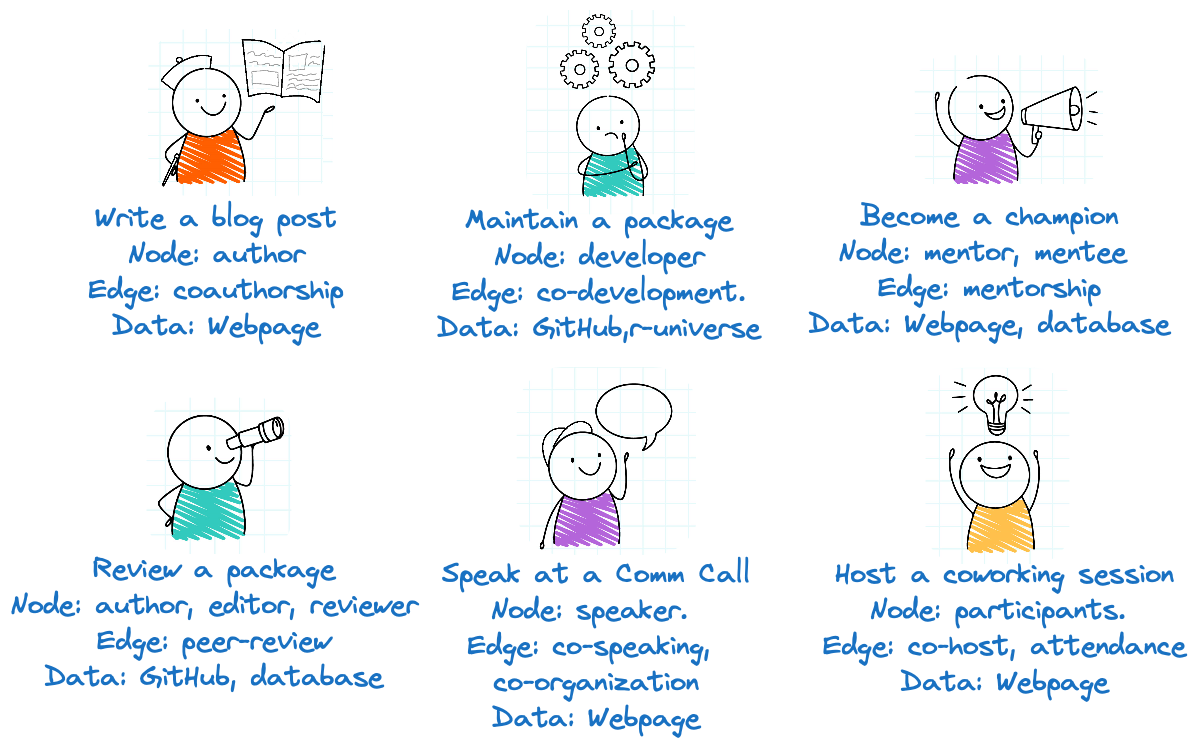
Contribution examples. Image by freepik
Many of these forms of contribution can be made with other people and there we have our nodes and a connection between them. In our examples:
Blog posts: Nodes are the authors and the edge is coauthorship, by writing a post together. We can get that data from our website.
Package maintenance: Nodes are the authors, maintainers and contributors of a package, and the edge is the work conducted on a package in common. This information is on GitHub.
Champions: Nodes are mentors and mentees, and the edge is the mentorship relationship. The data is in our mentorship program database and on our webpage.
Package review: Nodes are the authors, editors and reviewers, and the edge is the peer-review conducted together. The data source is our peer-review database and the GitHub repository and issues where the peer-review takes place.
Community Calls: Nodes are the speakers, host and moderators, and the edge is participation in the same call. The data is in our community calls database and on our webpage.
Coworking: Nodes are the attendees and the hosts, and the edge is participation in the same session. The data is on our our webpage.
As we can see, there are many ways to represent interactions and collaborations in our community, and all identifying information is open and public as well as most of the details.
When we put all this information together, we can build a network of interactions and collaborations within our community. This is how our network looked like in 2022. You can see clusters of nodes of the same colour indicating groups of collaborators within our community, as well as some larger nodes, indicating people with a large number of interactions.
When we zoom or filter the network we can see the details of the collaborations. These analyses give us information about which activities generate interactions and what kind of interactions they are. For example, the pink cluster includes people who were part of the rOpenSci staff and the red cluster includes people who participated in the Australian unconference.
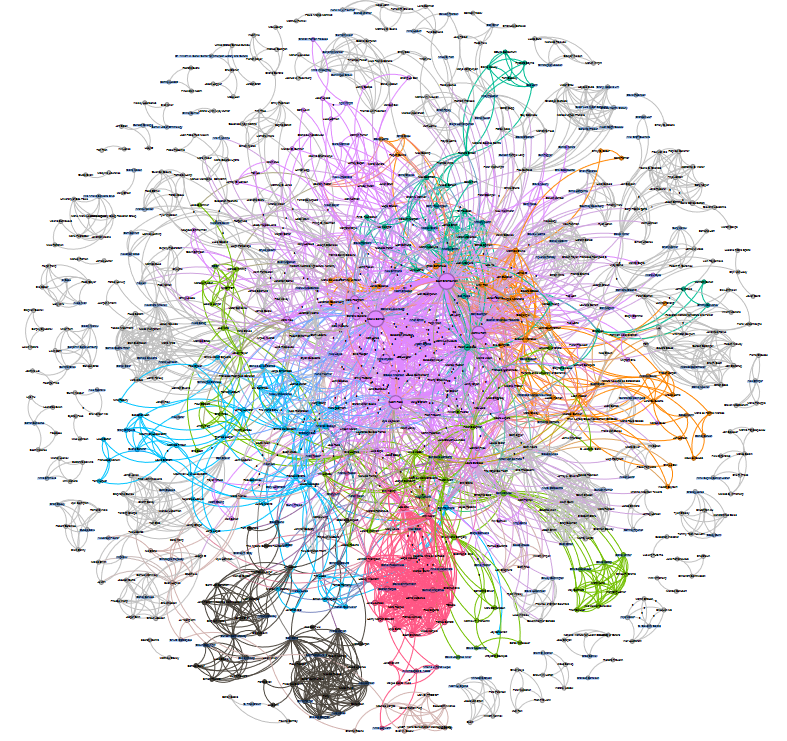
rOpenSci full collaboration network maped in 2022.
This network is built from interactions gathered from public data about rOpenSci blogs posts, guides, events, packages, reviews, translations and Champions Program. It is not complete, because do not include other spaces like our Slack or our Forum, but is a good approximation.
🔗 Using R to build the network
The best part is that we were able to create these networks with R! In this workflow we used several packages to help manipulate the data and perform the analysis. We used fs, dplyr, tibble, readr, and rmarkdown to extract, summarize and save the data, and we used igraph to perform and visualize the network analysis.
Let’s take a look at how we built this network looking at blog posts as an example. With the blog posts we can extract the data (title, list of authors, and date) we need from the webpage YAML for each post.
---
title: Agrandando nuestra comunidad con publicaciones multi-idioma
author:
  - Yanina Bellini Saibene
  - Pao Corrales
  - Elio Campitelli
  - Maëlle Salmon
date: '2023-01-12'
[...]
---
The following code performs this task and saves the data in a csv file:
- Read all the files in the
content/blog/folder with the.mdextension - Create a tibble with the variables to store:
date,title,author,yearandcontribution_type. - For each markdown document
- Read the YAML header, extract the value of each variable
- Add a row in the dataset with the information
- After processing all the documents, we save the dataset to a CSV file
file_list <- fs::dir_ls(path = "content/blog/",
                        recurse = TRUE,
                        type = "file",
                        glob = "*.md")

datos <- tibble::tibble(date = character(),
                        title = character(),
                        author = character(),
                        year = character(),
                        contribution_type = character())

for (documento in file_list){
  doc <- rmarkdown::yaml_front_matter(input = documento)
  datos <- tibble::add_row(datos,
                           date = doc$date,
                           title = doc$title,
                           author = doc$author,
                           year = as.character(year(date(doc$date))),
                           contribution_type = 'blog post'
                           )
}

readr::write_csv(datos, "blog_post_authors.csv")
The next step is to transform the list of authors into a network format: a table where each row represents an interaction (edge) between two nodes with accompanying meta data.
First we’ll create the nodes: authors and how many blog post each author wrote.
library(dplyr)
authors <- datos |>
  group_by(author) |>
  mutate(n = n()) |>
  select(author, n) |>
  distinct()
Next, we’ll create the edges or relations between the nodes.
This code takes the blog data, grouped by title and year, and keeps only posts with two or more authors.
Then, for each group, the combn() function creates a matrix representing all the unique combinations of a pair of authors. This data is then transposed (t()) resulting in two columns that become from and to, representing the nodes.
relations <- datos |>
  group_by(title, year) |>
  filter(n() > 1) |>
  summarise(as.data.frame(t(combn(author, 2)))) |>
  select(from=V1, to=V2, title, year)
Now, we can use the igraph package to create and plot the rOpenSci collaboration network of blog post authors from 2014 to June 2024!
library(igraph)

g_blog <- graph_from_data_frame(d = relations,
                                vertices = authors,
                                directed = FALSE)

plot(g_blog,
     vertex.size = 4,
     vertex.label.cex = 0.5,
     edge.arrow.size = 0.5,
     edge.curved = 0.5,
     edge.width = 0.5)
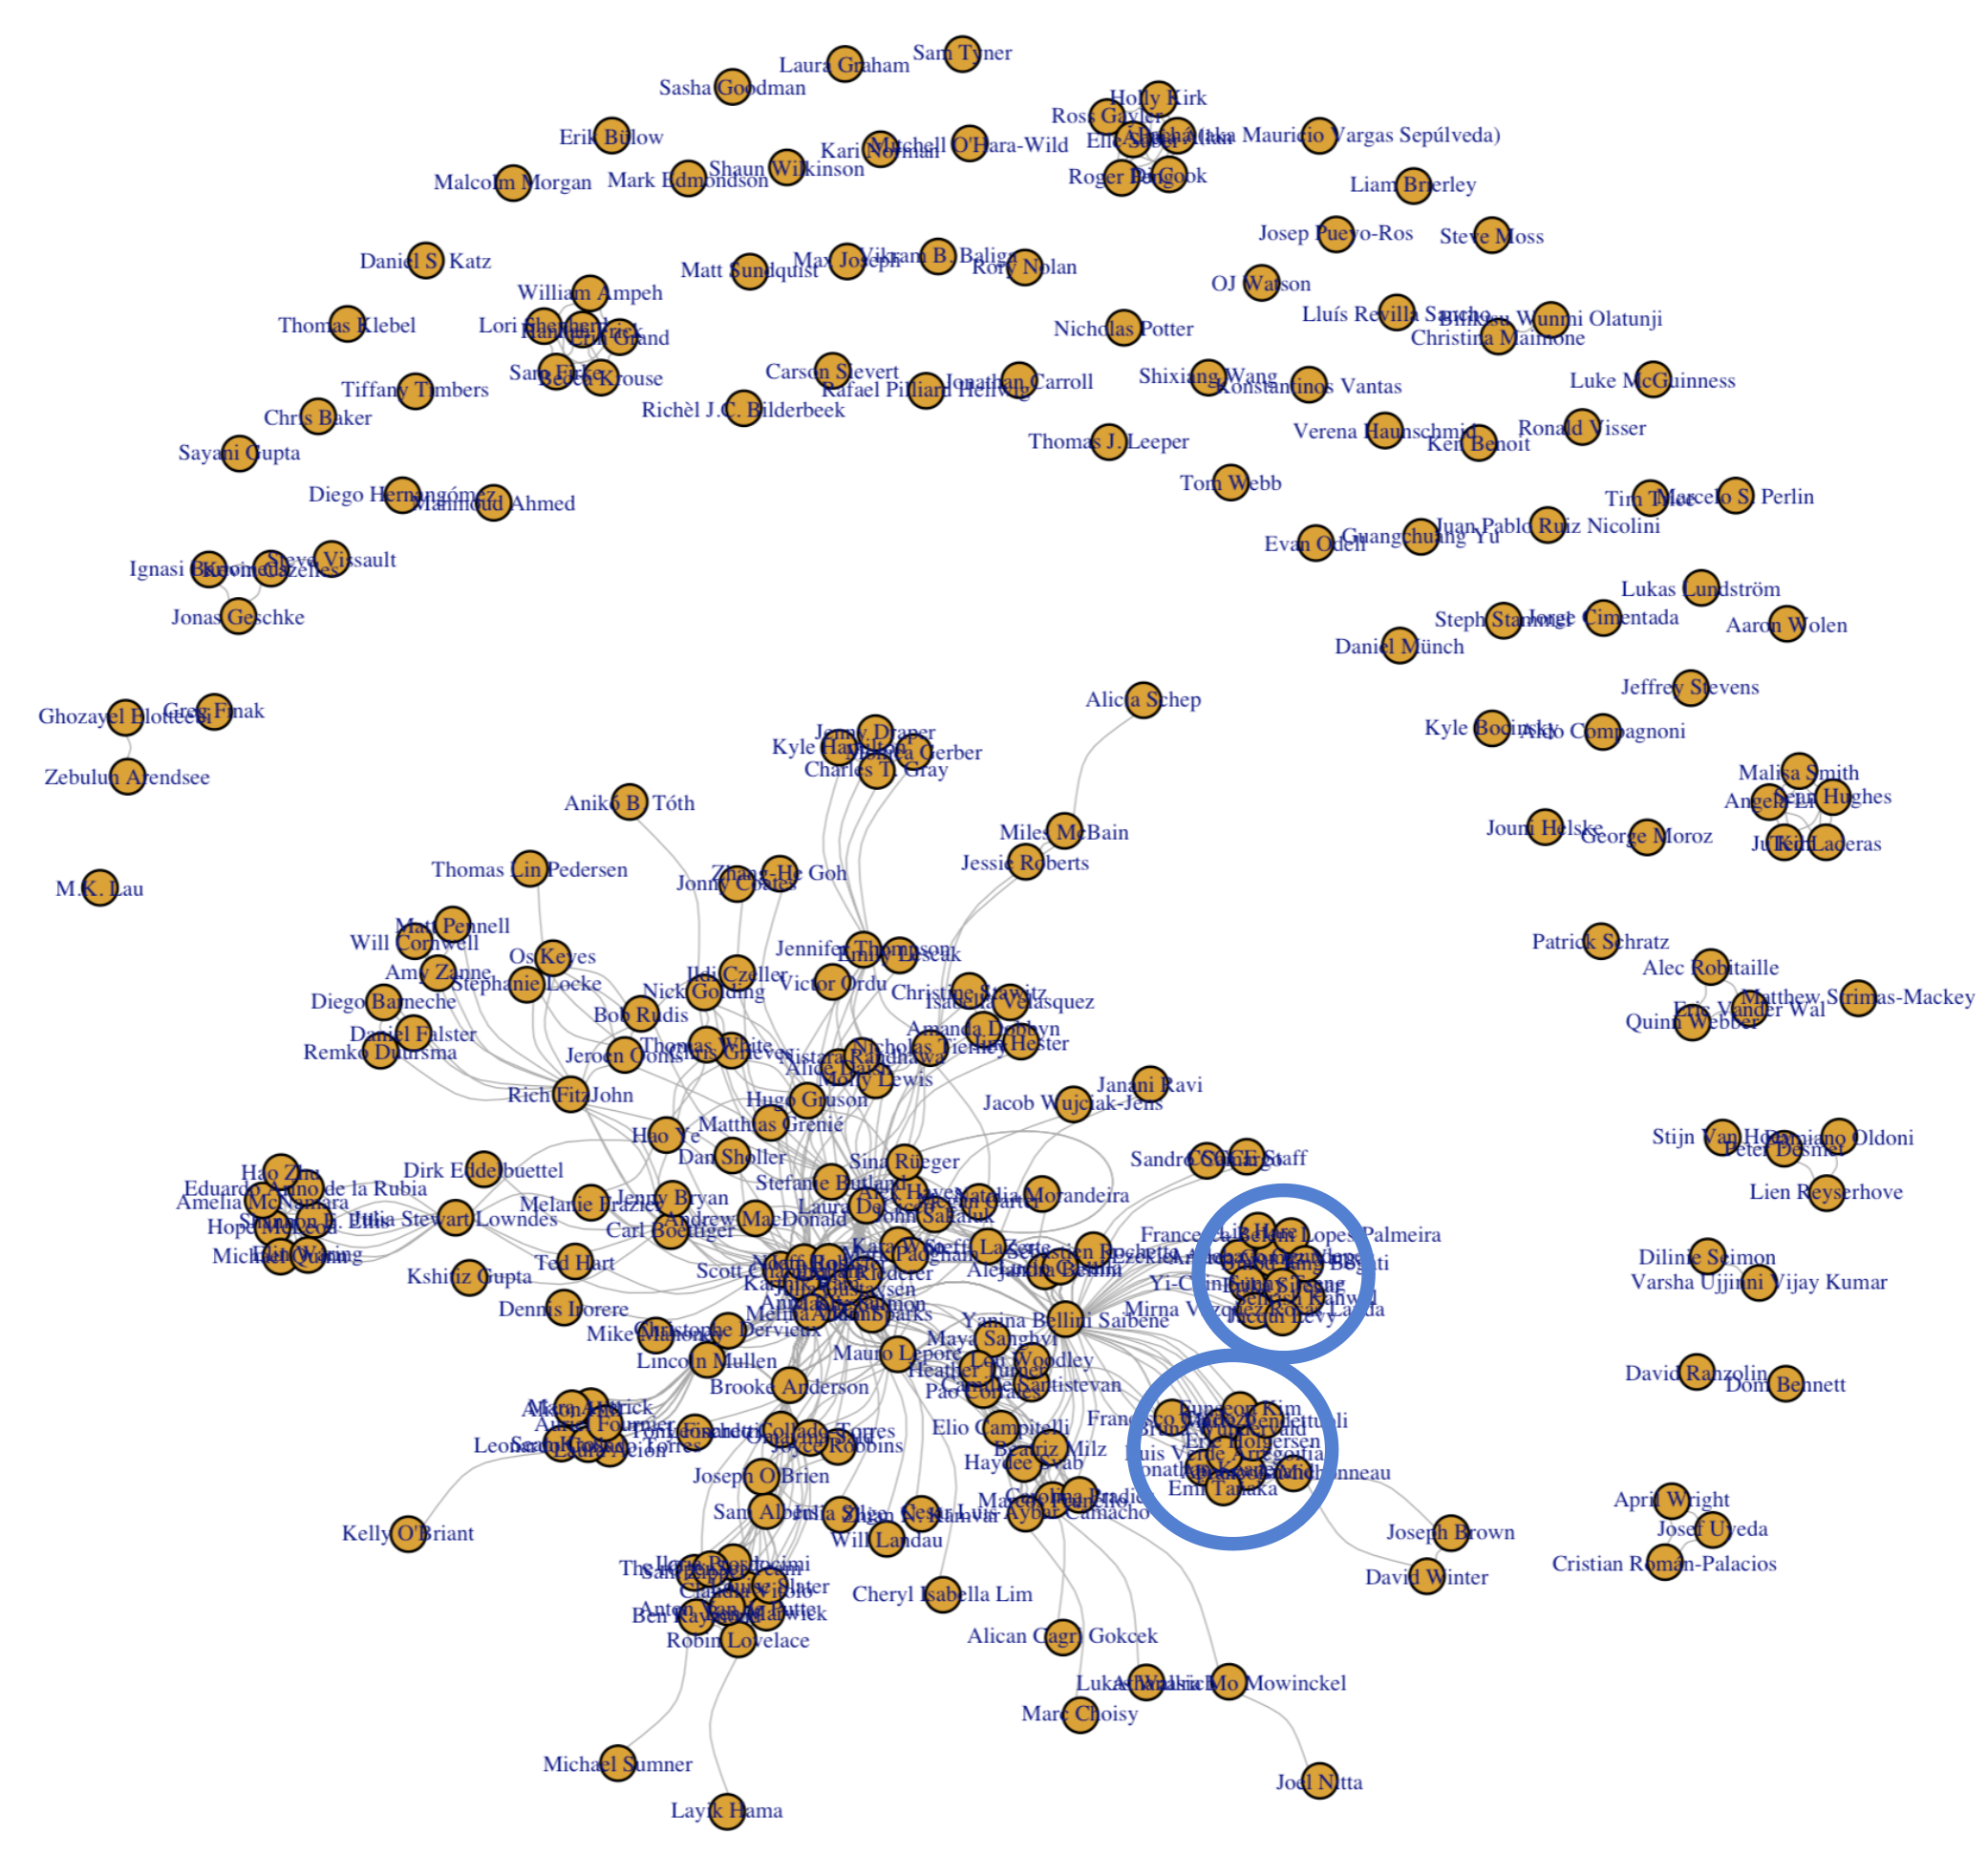
rOpenSci’s blog post authors collaboration network from 2014 to 2024.
We can see that many authors wrote blog posts without collaborators. However, we can also see that there are clusters of coauthors who have written posts together, sometimes only with a specific set of collaborators (the ‘silos’, clusters without a connection to the main network), and sometimes with multiple groups (acting as ‘hubs’ in the network). By analyzing the cluster, we can learn about the topics a series of authors are interested in, or the activities they are involved in. For example, the two clusters marked on the network map are the rOpenSci’s second cohort Champions and Mentors.
In addition to this visual assessment, we can also calculate the number of nodes, the degree1 of each node, the betweenness2 and the closeness3 to analyze some of the characteristics of the nodes and the network.
vcount(g_blog)
degree(g_blog)
betweenness(g_blog)
closeness(g_blog)
Looking at these metrics, we see that the network has 253 nodes, which means that 253 unique people have written for the rOpenSci blog. We can also see that our current Executive Director, Noam Ross, has the highest degree1 and the highest betweenness, likely reflecting his role as Software Review Lead over the years (Noam’s node is in the middle of the dense clump of nodes in the center of the network). Similarly, Yani (“Yanina Bellini Saibene”, in the network diagram) shows many connections to different clusters and individual nodes, again, likely reflecting her role as Community Manager.
🔗 Using Social Network Analysis in your community
Social Network Analysis is a powerful tool for understanding interactions and collaborations in a community and there are powerful R packages to help with the analysis. So, what if you wanted to do the same for your community? Here are our tips.
- Think about what the nodes in your community are (people, countries, organizations, …?)
- Think about the type(s) of connection you have in your community.
- Start with your paths for contributions.
- Identify which contributions can be done in teams.
- Consider that you might already have information about these connections.
- Take into account open/closed data and any privacy considerations.
- Automate what you can in the data collection.
- Formalize the workflow (code ;-)) so you can repeat & reproduce.
- Remember that it is hard to capture all type of interactions.
- You can take snapshot of the network model …
- … so you can compare it at different times.
- … so you can use it for measure the impact of interventions and programs.
- Share what you find with your community
- … and other community managers!
🔗 Conclusion
Social Network Analysis is a valuable tool for better understanding and guiding your community. Here, we demonstrated a small example how you might use Social Network Analysis to explore Communities of Practice.
Other explorations might include creating a network for each year and examining how the model changes over time. Or perhaps looking at how part of the network changes, for example only looking at blog posts in Spanish. We could map the network to geographic area and explore which countries are most represented and which have more or few collaborations among them.
There are many different aspects of a community that can be explored with Social Network Analysis and we hope that you find this tool useful in your communities.
Filed under
Suggest an edit
Open a pull request
