
Wednesday, June 3, 2015 From rOpenSci (https://ropensci.org/blog/2015/06/03/baad/). Except where otherwise noted, content on this site is licensed under the CC-BY license.
Despite the hype around “big data”, a more immediate problem facing many scientific analyses is that large-scale databases must be assembled from a collection of small independent and heterogeneous fragments – the outputs of many and isolated scientific studies conducted around the globe.
Collecting and compiling these fragments is challenging at both political and technical levels. The political challenge is to manage the carrots and sticks needed to promote sharing of data within the scientific community. The politics of data sharing have been the primary focus for debate over the last 5 years, but now that many journals and funding agencies are requiring data to be archived at the time of publication, the availability of these data fragments is increasing. But little progress has been made on the technical challenge: how can you combine a collection of independent fragments, each with its own peculiarities, into a single quality database?
Together with 92 other co-authors, we recently published the Biomass And Allometry Database (BAAD) as a data paper in the journal Ecology, combining data from 176 different scientific studies into a single unified database. We built BAAD for several reasons: i) we needed it for our own work ii) we perceived a strong need within the vegetation modelling community for such a database and iii) because it allowed us to road-test some new methods for building and maintaining a database 1.
Until now, every other data compilation we are aware of has been assembled in the dark. By this we mean, end-users are provided with a finished product, but remain unaware of the diverse modifications that have been made to components in assembling the unified database. Thus users have limited insight into the quality of methods used, nor are they able to build on the compilation themselves.
The approach we took with BAAD is quite different: our database is built from raw inputs using scripts; plus the entire work-flow and history of modifications is available for users to inspect, run themselves and ultimately build upon. We believe this is a better way for managing lots of #otherpeoplesdata and so below share some of the key insights from our experience.
🔗 1. Script everything and rebuild from source
From the beginning of the project, we decided to script everything. We wanted the entire work-flow of transforming raw data files into a unified database to be completely scripted and able to be rerun at any point. When your work-flow is scripted, you can make a small change and then rebuild the database in an instant. Another reason for scripting is that it ensures all the modifications to the data are well documented. This simply isn’t possible in Excel. Looking at our code, you can see exactly how we modified the data to arrive at the end product.
The only potential cost of continually rebuilding the database is that the process of rebuilding can take time. In the end, the time taken to make all the transformations and combine all 176 studies was pretty minimal – ~9 seconds all-up. But the job of continually rebuilding the database became a lot quicker once we started using remake 2. Remake caches built objects (e.g. the transformed data from each study) and only rebuilds each of them if either the data or code generating that particular object has changed. So after the first longer run, rebuilding the entire database takes in the range of 1–2 seconds.
Another advantage of constantly rebuilding is that we were forced to make our code more robust and portable, so that it would run safely on all the collaborators machines. Recently we took this one step further by setting up some automated builds, using a continuous integration system (Travis) that automatically rebuilds the database on a fresh remote virtual machine 3. This approach allows us to detect undocumented dependencies or changes to dependencies that would prevent others rebuilding the database.
The current status of the BAAD is: 
🔗 2. Establish a data-processing pipeline
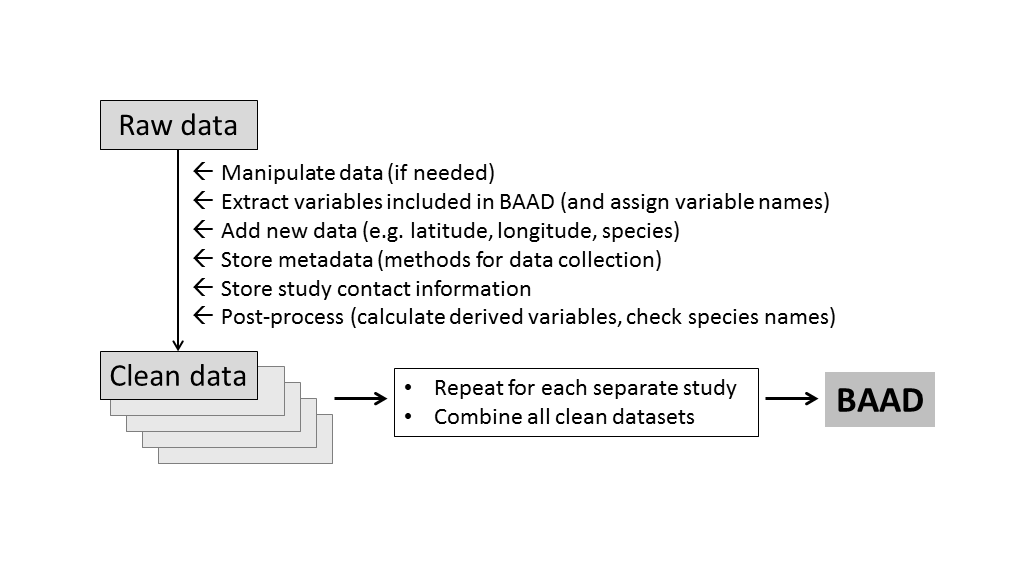
The hashtag #otherpeoplesdata documents the challenge and frustrations of working with data that were curated by others. (We each have our own ways of preparing a dataset, but often the logic we bring to the problem cannot be inferred by others from the spreadsheet alone.) For us, the trick to working with large amounts of #otherpeoplesdata was to establish a solid processing pipeline, and then focus on getting every new study into that pipeline. Once in the pipeline, a common set of operations is applied (Figure 1). So the challenge for each new study was reduced from “transform into final output”, to “get it into the pipeline”.
Figure 1: Work flow for building the BAAD. Data from each study is processed in the same way, using a standardised set of input files, resulting in a single database with a common format.
The following principles were applied in establishing our processing pipeline.
🔗 Don’t modify raw data files
Raw data is holy. A back-of-the-envelope calculation suggests the data we are managing would cost millions to collect afresh. We decided early on that we would aim to keep the original files sent to us unchanged, as much as possible. In many cases it was necessary to export an Excel spreadsheet as a csv file, but beyond that, the file should be basically as it was provided. A limited number of actions were performed on raw data files such as (click on links for examples) incorporating an updated dataset from a contributor, or minor modifications allowing data to be loaded into R, including modifying line endings 4, removing a string of trailing empty columns, removing special characters causing R to crash, and making column names unique.
The types of operations that were not allowed include data-transformations and creation of new columns – these were all handled in our pipeline.
🔗 Encode meta-data as data, not as code
In the early stages of our project, we encoded a lot of the changes we wanted to make to the data into our R scripts. For example, the code below is taken from early in the project’s history:
	if(names[i]=="Kohyama1987"){
		raw        <-  read.csv(paste(dir.rawData,"/",names[i],"/data.csv", sep=''), h=T, stringsAsFactors=FALSE)
		raw$SpecCode[raw$SpecCode=='Cs']  <-  "Camellia sasanqua"
		raw$SpecCode[raw$SpecCode=='Cj']  <-  "Camellia japonia"
		...
		...
		raw$leaf.mass  <-  raw$Wtl.g + raw$Wbl.g
		raw$m.st       <-  raw$Wts.g + raw$Wbs.g
		new[[i]]   <-  cbind(dataset=names[i], species=raw$SpecCode, raw[,c(5:8, 14:ncol(raw))], latitude=30.31667, longitude=130.4333, location="Ohkou River, Yakushima Island, Kyushu, Japan", reference="Kohyama T (1987) Significance of architecture and allometry in saplings. Functional Ecology 1:399-404.", growingCondition="FW", vegetation="TempRf", stringsAsFactors=FALSE)
	}
The code above shows operations for a single study: loading raw data, making new columns, save the compiled object. The problem with this code is that it mixes in a bunch of useful data with our R code. We had not yet identified a common pipeline for processing data. Eventually we moved all this extra data into their own .csv files and treated them as we should, as data. We then use functions to modify the raw data, using the new files as input.
Each study in the database was therefore required to have a standard set of files to enter the data-processing pipeline:
data.csv: raw data table provided by authors.dataMatchColumns.csv: for each column indata.csv, provides units of the incoming variable, and the name of the variable onto which we want to map this data.dataNew.csv: allows for addition of any new data not present indata.csv, or modification of existing values based on a find-and-replace logic.studyMetadata.csv: information about the methods used to collect the data.studyContact.csv: contacts and affiliations information for contributors.studyRef.bib: bibliographic record of primary source, in bibtex format.
Changes are then made using lookup tables.
There are several important benefits to this approach of separating code from data:
- it is highly scalable.
- it separates data from code, so that potentially someone could replace the R code using the exact same data.
- it drastically reduced the amount of R code needed.
🔗 Establish a formal process for processing and reviewing each data set
We established a system for tracking the progress of each dataset entering BAAD
- Initial screening (basic meta-data extracted from paper).
- Primary authors contacted (asking if they wish to contribute).
- Initial response from authors (indicating interest or not).
- Email sent requesting raw data from authors.
- Raw data received from authors.
- Data processed and entered into BAAD (we filled out as much of information as we could ourselves).
- A review of data, including any queries, sent to authors for error checking.
- Data approved.
- Data excluded because of issues that arose (no response, not interested, could not locate data, data not suitable etc.).
At each stage we automated as much as possible. We used a script to generate emails in R based on information in our database, and made it as easy as possible for the contributors to fulfil their tasks and get back to us.
Step 7, where we inspected data for errors, was still time consuming. To make this easier for both us and original contributors, we used the package knitr (using this Rmd template) to create a standardised report for each study. Each report includes a processed version of the data and metadata, including maps of study site locations and bivariate plots of all variables provided in this study, overlayed against the rest of the data from BAAD. The current set of reports can be viewed on our wiki, with one page for each study ([https://github.com/dfalster/baad/wiki/BondLamberty2002](for example))
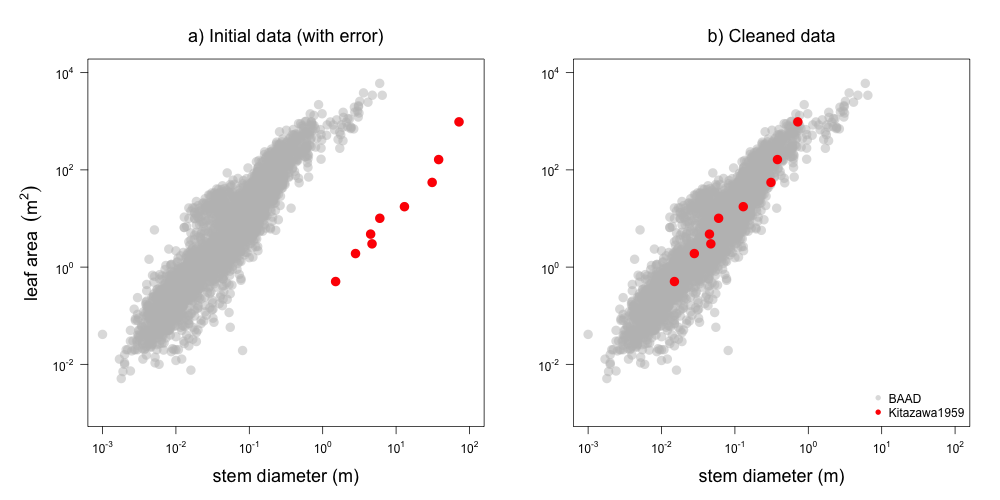
The generated reports are useful in two key ways: i) they provide a nice overview of the data contributed from any single study, and ii) they were invaluable in identifying errors (Figure 2).
Figure 2: Example plot from report on Kitazawa1959 dataset, showing how data from this study (red) is displaced from the rest of the dataset (grey). The problem was fixed in this commit by changing cm to m as the unit description in the meatadata (i.e. we did not change the data itself but the transformation used in the processing pipeline).
🔗 3. Use version control (git) to track changes and code sharing website (github) for effective collaboration
The BAAD project began in July 2012, in Feb 2013 Rich FitzJohn got involved and introduced us to version control. You can see the structure of our database at that time here. We can’t recall that much about what happened prior 13 Feb 2013, but since that day, every single change to the BAAD has been recorded. We know who changed what lines of code or data and when. Many people have been extolling the virtues of git for managing computer code (e.g. Chacon 2009), but others have noted that git is equally good for managing data (Ram et al 2013) 5.
Alongside git, we used the code-sharing website Github to host our git repository. Github facilitates seamless collaboration by:
- syncing changes to scripts and data among collaborators.
- allowing us track the many issues identified while reviewing data sets.
- providing a nice interface for seeing who changed what and when.
- allowing others to make changes to their data.
- releasing compiled versions of the data.
🔗 4. Embrace openness
BAAD is far from the first compilation in our field, but as far we know, it possibly the first to be entirely open. By entirely open, we mean
- the entire work flow, including its history, is open and transparent;
- the raw data and meta-data are made available for others to reuse in new and different contexts;
- the data is immediately available on the web, without need to register or login into a site, or submit a project approval.
Anyone can use the compiled data in whatever way they see fit. Our goal was to create a database that many scientists would immediately want to use, and that would therefore get cited.
Another concern was that the database would be sustainable. By making the entire process open and scripted, we are effectively allowing ourselves to step away from the project at some point in the future, if that’s what we want to do. Moreover, it allows future researchers who are out in the field collecting more raw data to contribute to the this existing unified database.
🔗 5. A living database
We hope that BAAD will continue to grow. To that end, we have written a very small package baad.data for accessing data by version in R. After installing the package (instructions here), users can run
library(baad.data)
x <- baad_data("1.0.0")
to download the version stored in Ecological Archives, or
x <- baad_data("x.y.z")
to download an earlier or more recent version (where version numbers will follow the semantic versioning guidelines, eg. “0.9.0”). The baad.data package caches everything so subsequent calls, even across sessions, are very fast. This should facilitate greater reproducibility by making it easy to depend on the version used for a particular analysis, and allowing different analyses to use different versions of the database.
🔗 Conclusion
We really hope that the techniques used in building BAAD will help others develop open and transparent compilations of #otherpeoplesdata. On that point, we conclude by thanking all our wonderful co-authors who were willing to put their data out there for others to use.
🔗 Footnotes
BAAD is a database in the sense that it is an organized collection of data, but we do not use common database tools like SQL or Microsoft Access etc. These are simply not needed and prevent other features like version control. ↩︎
The package
remakewas originally called maker and was introduced on Nov 19 2014, relatively late in development of BAAD. Earlier we experimented we building a package dataMashR to implement the conversions, but eventually settled on the remake work-flow. DataMashR lives on as a working prototype. ↩︎You can see the record of the automated builds here ↩︎
Excel makes a mess of line endings on Mac and has done for a long time - see here for our thoughts and an early solution. ↩︎
Provided the data is not too large. Github works with files < 100MB and for git repositories < 1GB. Although there are strategies for larger sizes. ↩︎
Filed under
Suggest an edit
Open a pull request
