
Monday, December 12, 2016 From rOpenSci (https://ropensci.org/blog/2016/12/12/ropensci-fellowship-zoon/). Except where otherwise noted, content on this site is licensed under the CC-BY license.
rOpenSci’s overarching mission is to promote a culture of transparent, open, and reproducible research across various scientific communities. All of our activities are geared towards lowering barriers to participation, and building a community of practitioners around the world. In addition to developing and maintaining a large suite of open source tools for data science, we actively support the research community with expert review on research software development, community calls, and hosting annual unconferences around the world.
To further promote reproducible research activities within specialized domains, we will soon be announcing our annual fellowship program. These fellowships will provide support for collaborative research projects that strengthen one or more of rOpenSci’s core efforts. These activities may include development of new domain-specific tools, or supporting projects that are exemplars of reproducible research. Our early fellowships are by invitation and an open call will be forthcoming in early 2017.
We are pleased to award the first fellowship to Dr. Nick Golding to continue developing a framework for building and sharing reproducible species distribution models (SDM). Nick Golding is a Research Fellow in the Quantitative & Applied Ecology Group at the University of Melbourne, Australia. He develops statistical models and software to predict the distributions of species and human diseases like those caused by the Zika and Ebola viruses. Nick is particularly interested in improving these models with information about traits, mechanistic relationships and population dynamics.
We interviewed Nick to learn more about him, the project, and what the fellowship will help him and his collaborators accomplish.
🔗 Q: What is the Zoon Project?
The Zoon Project began in the Computer Science department in Oxford as part of the EPSRC-funded 2020 Science project, and is a collaboration between a group of researchers with interests in SDM, scientific software and building better research communities. The name (Zoon) refers to an individual that is part of a compound organism, like the polyps that make up jellyfish. It’s a bit of a geeky name (you can blame Greg McInerny for that), but it fits well with the project’s aim to improve collaboration in this area of science.
The main piece of the project is an R package: zoon; that allows you to develop your SDM analysis as a reproducible workflow. SDM involves taking records on where species have been observed and the environmental characteristics of those locations, representing these mathematically, and applying algorithms to turn these into predictions of geographical species distribution. The field of SDM within ecology has boomed in the last fifteen years1 (free pdf) coinciding with the increase in data and the birth of machine learning. The challenge is that the field is now a crowded and confusing place. There are hundreds of different candidate models, and probably thousands of papers on SDM methods, with each new method generally evaluated against a different dataset. That poses a serious hurdle to the community objectively evaluating the available methods and can be baffling to newcomers to the field.
In other applications of machine learning, there are benchmark datasets used by everyone in the community to evaluate methods (e.g. MNIST and many more). There are also software platforms (like caret) that enable many of the candidate methods to be run from the same software, and compared on the same dataset. We don’t currently have either of these things for SDM, which makes it really difficult to synthesize information from the literature. The motivation for the Zoon Project is to address this reproducibility challenge faced by the community.
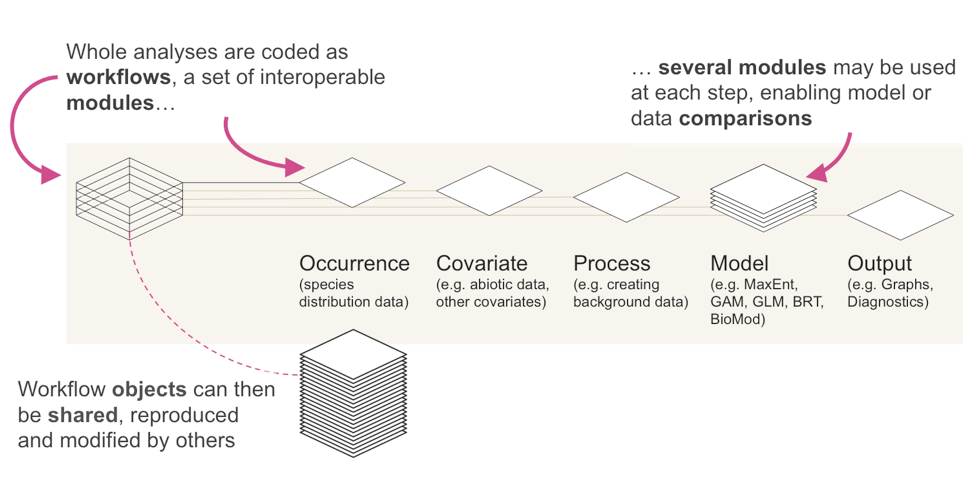
The Zoon package implements SDM analyses as workflows of bite-sized, interoperable software modules. Each module represents one of the five key steps in an SDM analysis.
- Get data on where species occur
- Get environmental data
- Pre-process data
- Plug data into a model
- Generate some outputs
Multiple modules can be used at each stage, allowing them to be combined or compared and because modules can be switched in and out it’s easy to quickly see how an analysis would change if a different method or dataset were used.
What makes the Zoon project unique is that all of these modules are developed by the community (not the Zoon team) and held together in an online repository, just like community-contributed R packages (but much easier). Basically, each software module has to conform to a set of input and output formats to make sure the modules are interoperable, and also requires some basic documentation. The zoon R package helps users to write, document, test and share these modules so that everyone, not just experienced R developers, can contribute modules.
🔗 Q: What’s an example of a research question that can be addressed using the Zoon R package?
SDM is increasingly being used in epidemiology and public health research. For example, the recent outbreak of Ebola in West Africa occurred in a place people weren’t really expecting, so being able to anticipate where future outbreaks might start is pretty important. During the outbreak, I worked with some colleagues to develop an SDM to identify areas in Africa that are environmentally similar to those where previous human outbreaks have started2 (code). This used location data for humans and animals infected with Ebola, environmental covariates like vegetation, elevation, temperature and evapotranspiration, and a machine learning method known in the SDM world as Boosted Regression Tree modelling. We didn’t have Zoon back then, but it would have made that whole workflow quicker to put together, and really easy to quickly evaluate the effects of changing model assumptions on areas predicted to be at risk of future outbreaks.
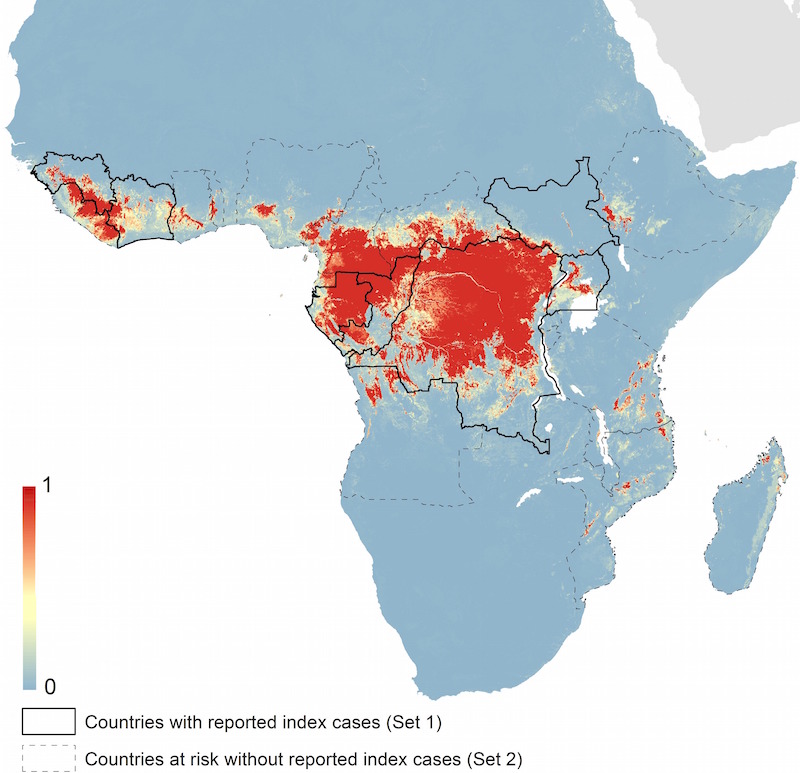 Predicted geographical distribution of the zoonotic niche for Ebola virus.3 The scale reflects the relative probability that zoonotic transmission of Ebola virus could occur at these locations; areas closer to 1 (red) are more likely to harbour zoonotic transmission than those closer to 0 (blue). (Figure 5B from Pigott et al 2014. CC BY 4.0)
🔗 Q: What would you like to accomplish with your fellowship?
We’ve already done most of the technical work in setting up the software and online repository for Zoon, what we really need now is to build a community of SDM users who can apply and contribute modules to the online repository, as well as SDM experts to help the community start to synthesize all of the published research. During the term of the fellowship I’ll be developing an online hub for community-contributed SDM resources (SDM guides for beginners and best practice guidelines around different aspects of SDM) to make it easier for new SDM users to get started, and a forum where SDM experts can discuss what these best practice guides should look like.
The Zoon Hub will include:
- A single web-based portal for new users
- A basic introduction with tutorials to enable someone new to SDM to fit a model using the R package and share their workflow with others. The objective here is to make Zoon easy to use so new SDM users get started using software with reproducibility baked in.
- A series of expert-written best practice guides, covering contentious or nuanced topics in SDM methodology, like dealing with biases in occurrence data. Each of these guides will be backed up by reproducible examples in the form of Zoon workflows. We’ll be soliciting feedback on these guides from SDM methods experts via an open online forum. We’ll be encouraging any disputes about best practice to be resolved in an evidence-based way by sharing workflows that demonstrate a point.
We want new SDM users to try out the tutorials and guides and tell us how they’re working. We have a group of experts who will advise us on best practices, but we’ll invite others to tell us what’s wrong with our suggestions. We’d also love to hear advice on infrastructure from people who live and breathe reproducible software. Our ultimate aim is to build a self sustaining community suggesting, discussing, and implementing new elements.
The rOpenSci fellowship allows us to complete this next step of Zoon development, moving the discussion from one of opinions on which models are best, to one of testable reproducible evidence-based answers.
🔗 Q: How did you arrive at working in an environment where you apply computational statistical skills to epidemiology?
I started with an undergraduate degree in ecology from John Moores University in Liverpool and then worked as research assistant, briefly doing real biology (even some pipetting in a lab). I then did my PhD in mosquito ecology at Oxford, during which time I steadily drifted from field-based research to statistical ecology and particularly SDM. After three years as a Postdoc in Oxford applying these methods to mapping diseases, I moved to the University of Melbourne in February 2016, where I’m a Research Fellow. My fellowship in Melbourne is about developing new statistical methods and software to improve our ability to map species and diseases.
🔗 Q: How did you hear about rOpenSci?
It’s hard to say, but I almost certainly first heard about rOpenSci on twitter. I’ve followed members of the team on there for a while, particularly because they’re part of an active online community interested in reproducibility in research. rOpenSci has lots of really useful tools. Packages like rgbif, which evolved into spocc are part of the core input that goes into SDM models in Zoon.
🔗 Q: If you could tell rOpenSci what tool to develop next, what would have the most impact on your research?
Unlike species occurrence data, there’s currently no single portal to access a wide array of different gridded environmental data (the maps of climatic and environmental conditions that SDM needs to make prediction maps). There are a couple of different data sources out there, with R interfaces to some of them, but it would be great to have access to all of them via a single R API.
Want to learn more about Nick Golding and Zoon?
- Nick will share more details about the Zoon Project, and outline how you can get involved, in a Spring 2017 Community Call.
- Zoon on GitHub
- Read Nick’s papers on Google Scholar.
- Follow Nick on Twitter
Barbosa, F. G., & Schneck F. (2015). Characteristics of the top-cited papers in species distribution predictive models. Ecological Modelling, 313: 77-83. https://doi.org/10.1016/j.ecolmodel.2015.06.014 ↩︎
Pigott DM, Golding N, Mylne A, Huang Z, Henry AJ, Weiss DJ, Brady OJ, Kraemer MU, Smith DL, Moyes CL, Bhatt S, Gething PW, Horby PW, Bogoch II, Brownstein JS, Mekaru SR, Tatem AJ, Khan K, Hay SI. (2014). Mapping the zoonotic niche of Ebola virus disease in Africa. Elife, 8(3), e04395. https://doi.org/10.7554/eLife.04395 ↩︎
Figure 5. Pigott DM, Golding N, Mylne A, Huang Z, Henry AJ, Weiss DJ, Brady OJ, Kraemer MU, Smith DL, Moyes CL, Bhatt S, Gething PW, Horby PW, Bogoch II, Brownstein JS, Mekaru SR, Tatem AJ, Khan K, Hay SI. (2014). Mapping the zoonotic niche of Ebola virus disease in Africa. Elife, 8(3), e04395. https://doi.org/10.7554/eLife.04395.009 ↩︎
Filed under
Suggest an edit
Open a pull request
