
Tuesday, July 11, 2017 From rOpenSci (https://ropensci.org/blog/2017/07/11/skimr/). Except where otherwise noted, content on this site is licensed under the CC-BY license.
Like every R user who uses summary statistics (so, everyone), our team has to rely on some combination of summary functions beyond summary() and str(). But we found them all lacking in some way because they can be generic, they don’t always provide easy-to-operate-on data structures, and they are not pipeable. What we wanted was a frictionless approach for quickly skimming useful and tidy summary statistics as part of a pipeline. And so at rOpenSci #unconf17, we developed skimr.
In a nutshell, skimr will create a skim_df object that can be further operated upon or that provides a human-readable printout in the console. It presents reasonable default summary statistics for numerics, factors, etc, and lists counts, and missing and unique values. And the momentum is still going, thanks to our awesome team (see below)!
🔗 Backstory
The idea for skimr as a project for the #unconf17 was proposed by Amelia McNamara following discussions on Twitter and an initial package by Hadley Wickham.
Once we were together in Los Angeles, we formed a solid team, set up a Google Doc, a Slack channel, the ropenscilabs/skimr repo, and grabbed a whiteboard.
We started off by brainstorming what we liked about existing summary packages and what other features we wanted. We started looking at example data, mtcars.
Here’s what we liked and disliked, in Amelia’s words:
### "I like what we get here because mpg is numeric so these stats make sense:"
summary(mtcars$mpg)
#   Min. 1st Qu.  Median    Mean 3rd Qu.    Max.
#  10.40   15.42   19.20   20.09   22.80   33.90


### "But I don’t like this because cyl should really be a factor and shouldn't have these stats:"
summary(mtcars$cyl)
#   Min. 1st Qu.  Median    Mean 3rd Qu.    Max.
#  4.000   4.000   6.000   6.188   8.000   8.000


### "This is OK, but not descriptive enough. It could be clearer what I'm looking at."
mosaic::tally(~cyl, data=mtcars) # install.packages('mosaic')
#cyl
# 4  6  8
#11  7 14


### "But this output isn't labeled, not ideal."
table(mtcars$cyl, mtcars$vs)
#
#     0  1
#  4  1 10
#  6  3  4
#  8 14  0


### "I like this because it returns 'sd', 'n' and 'missing'":
mosaic::favstats(~mpg, data=mtcars)
#  min     Q1 median   Q3  max     mean       sd  n missing
# 10.4 15.425   19.2 22.8 33.9 20.09062 6.026948 32       0
Once we had an idea of what we thought would be useful, we did a bit of market research (i.e. we made a short presentation and ran it by other unconfers at lunch.
🔗
Introducing skimr
So what does skimr actually do? It allows you to skim useful summary statistics in the console, or use those statistics in a pipeable workflow.
Some features of output in the console:
- reports missing, complete, n, sd, and quantiles
- reports numeric/int/double separately from factor/chr, and identifies class
- handles dates, logicals
- uses Hadley’s colformats, specifically
colformats::spark-bar()
Here are examples of skimr in action:
🔗 Quick skim in the console:
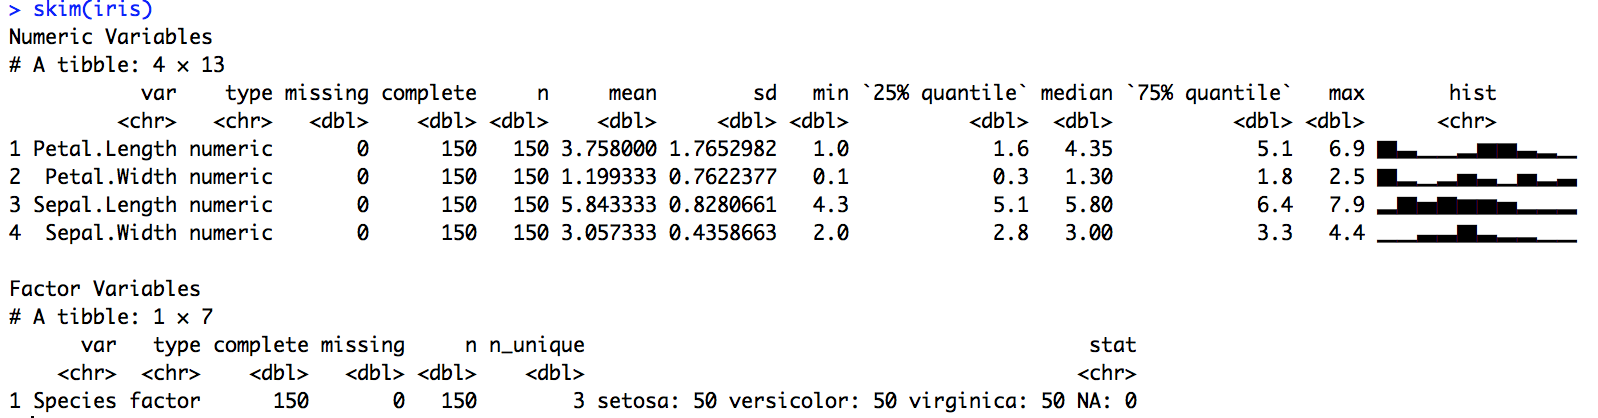
Nicely separates numeric and factor variables:
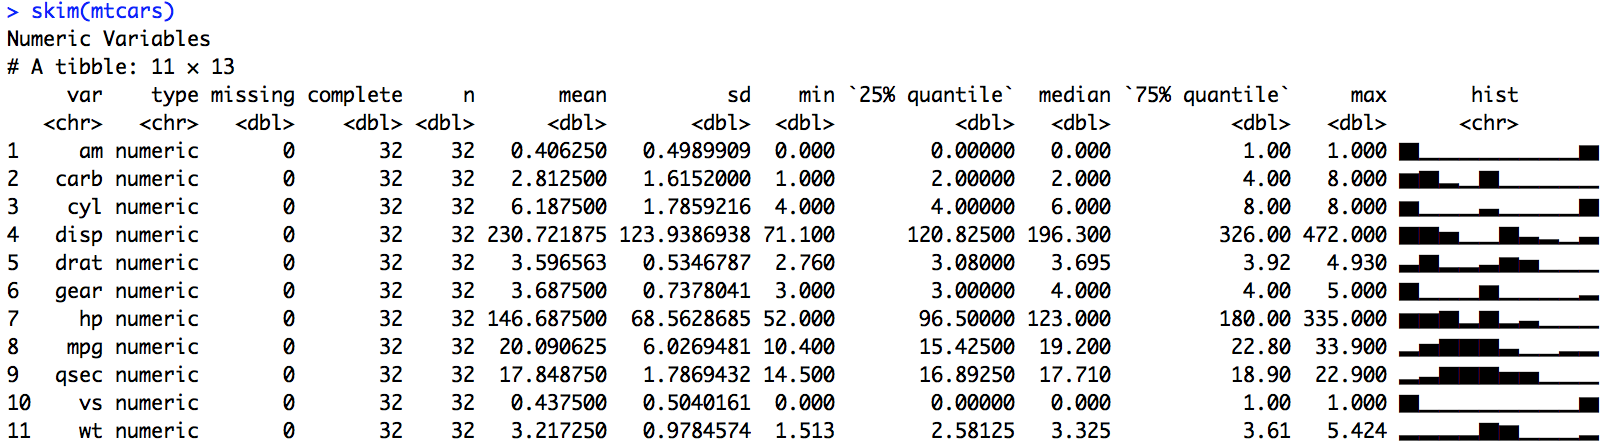
Clearly displays many numeric variables:
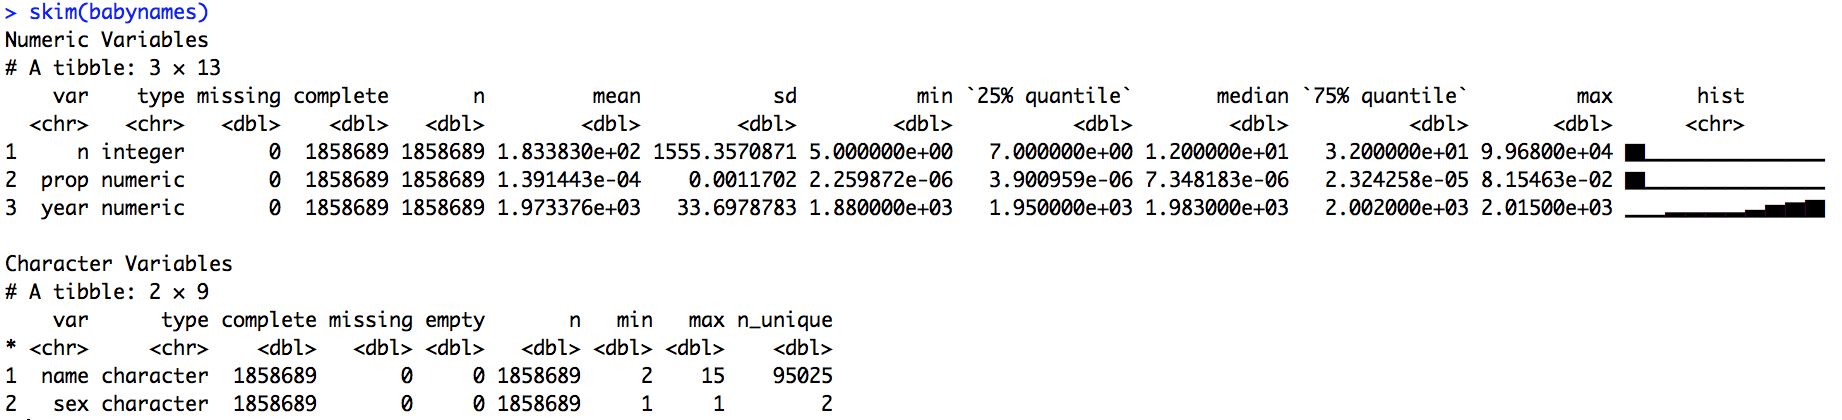
Also works with strings:
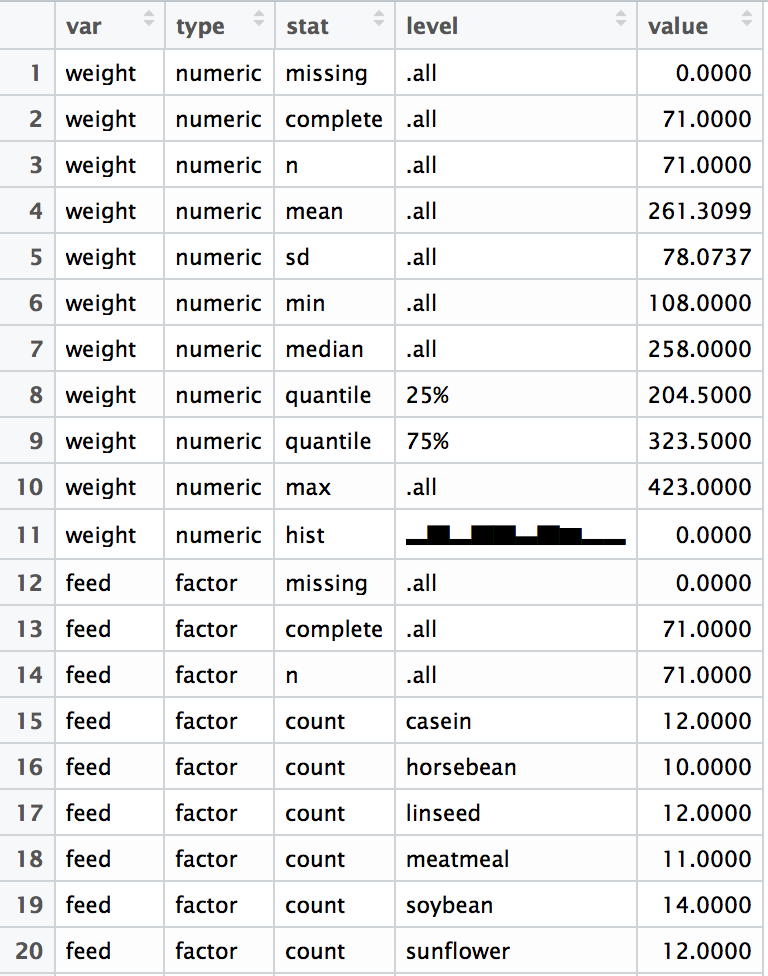
🔗 Exploring a skim_df object
By default skim prints beautifully in the console, but it also produces a long, tidy-format skim_df object that can be computed on.
a <-  skim(chickwts)
dim(a)
# [1] 22  5
View(a)
🔗 Computing with the skim_df object
Maybe you just want to skim a specific portion of your data frame. Use skimr with a pipe!
> skim(mtcars) %>% filter(stat=="hist")
# A tibble: 11 × 5
     var    type  stat      level value
   <chr>   <chr> <chr>      <chr> <dbl>
1    mpg numeric  hist ▂▅▇▇▇▃▁▁▂▂     0
2    cyl numeric  hist ▆▁▁▁▃▁▁▁▁▇     0
3   disp numeric  hist ▇▇▅▁▁▇▃▂▁▃     0
4     hp numeric  hist ▆▆▇▂▇▂▃▁▁▁     0
5   drat numeric  hist ▃▇▂▂▃▆▅▁▁▁     0
6     wt numeric  hist ▂▂▂▂▇▆▁▁▁▂     0
7   qsec numeric  hist ▂▃▇▇▇▅▅▁▁▁     0
8     vs numeric  hist ▇▁▁▁▁▁▁▁▁▆     0
9     am numeric  hist ▇▁▁▁▁▁▁▁▁▆     0
10  gear numeric  hist ▇▁▁▁▆▁▁▁▁▂     0
11  carb numeric  hist ▆▇▂▁▇▁▁▁▁▁     0
🔗 Specifying your own statistics
Another possibility is specifying your own statistics to display with skimr:
 funs <- list(iqr = IQR,
    quantile = purrr::partial(quantile, probs = .99))
  skim_with(numeric = funs, append = FALSE)
  skim_v(iris$Sepal.Length)

#  A tibble: 2 × 4
#      type     stat level value
#     <chr>    <chr> <chr> <dbl>
# 1 numeric      iqr  .all   1.3
# 2 numeric quantile   99%   7.7
🔗 Our awesome team
We had a really fantastic team with diverse backgrounds, and it was really cool how organically everyone found a role for themselves during the development of skimr. Between brainstorming sessions, experienced coders began to iteratively develop the code while others worked on documentation and tests, and got more involved. Everyone asked questions and brainstormed together; it was a really welcoming environment. We knew that by the end of the second day of the unconf, we would present our work using only the repo’s README file. So we focused on communication throughout the entire development process.
A lot of the heavy lifting at the unconf was done by Michael, Elin, and Eduardo, and Elin has continued leading development in the month since!
This was the original team in alphabetical order. We have also had many virtual contributors as well: see the full list of contributors here.
Eduardo Arino de la Rubia
Job Title: Chief Data Scientist at Domino Data Lab
Project Contributions: Coder
Shannon Ellis
Job Title: Postdoctoral fellow in the Biostatistics Department at the Johns Hopkins Bloomberg School of Public Health
Project Contributions: Test Scripts
Julia Stewart Lowndes
Job Title: Marine Data Scientist at the National Center for Ecological Analysis and Synthesis
Project Contributions: Documentation and test scripts
Hope McLeod
Job Title: Data Engineer at Kobalt Music
Project Contributions: Documentation
Amelia McNamara
Job Title: Visiting Assistant Professor of Statistical & Data Sciences at Smith College
Project Contributions: Coder
Michael Quinn
Job Title: Quantitative Analyst at Google
Project Contributions: Coder
Elin Waring
Job Title: Professor at Lehman College Sociology Department, City University of New York
Project Contributions: Coder
Hao Zhu
Job Title: Programmer Analyst at the Institute for Aging Research
Project Contributions: Coder
🔗 In summary (ha…)
The work we did together was only possible because of rOpenSci’s incredible community and culture. For us to be able to dream up something we wanted to build and have the time and space to actually do it together was really exciting. So thank you rOpenSci and everyone in the greater community!
There is more work to be done on skimr, so please check out the skimr repo for the latest features and improvements! There you’ll see how to install the latest version of skimr (with any needed dependencies). Check out the planned features and fixes on the issues page and give us feedback or join the team!
Filed under
Suggest an edit
Open a pull request
