
Tuesday, March 27, 2018 From rOpenSci (https://ropensci.org/blog/2018/03/27/door/). Except where otherwise noted, content on this site is licensed under the CC-BY license.
🔗 Olfactory Coding
Detecting volatile chemicals and encoding these into neuronal activity is a vital task for all animals that is performed by their olfactory sensory systems. While these olfactory systems vary vastly between species regarding their numerical complexity, they are amazingly similar in their general structure. The periphery of olfactory systems consists of different classes of olfactory sensory neurons (OSN). In mammals, OSNs are located in the nose, in insects, OSNs are located on the antenna. OSN classes are tuned to defined but overlapping sets of odors. Thus a single odor usually elicits differential responses across an ensemble of OSNs. This ensemble code is able to encode thousands of odors, even in comparably simple olfactory systems.
To better understand the underlying logic of this ensemble code, one would ideally want to know the specific ensemble codes each and every chemical elicits across an olfactory system, the so-called “olfactome”. Obviously this is not feasible to tackle experimentally, yet many labs work with e.g. the olfactory system of Drosophila and publish studies containing responses of different odor-OSN combinations.
DoOR takes these heterogeneous data measured in different labs, with different techniques in different metrics and maps/merges them into a common response space, creating a consensus data-set of all odor responses. By this, DoOR provides access to the most-complete version of the Drosophila olfactome available.
This consensus data-set is of interest in various aspects: Scientists working in olfaction use DoOR to plan experiments, i.e. to find odors that activate specific OSNs. Others performing physiological recordings use DoOR to identify OSNs based on measured odor responses and modelers use DoOR to explore the combinatorial code and to predict unmeasured odor responses.
🔗 The DoOR Development Process
DoOR started as the bachelor thesis of Shouwen Ma who was a bachelor’s student in Giovanni Galizia’s lab at the University of Konstanz. Shouwen took the tedious task to extract all odor responses from the existing Drosophila olfaction literature. When he was lucky he found digital versions of these data in the supplemental material of the studies but in many cases he had to manually copy numbers from printed tables or even extract data from plots.
With this data being available we then formed a team consisting of Giovanni Galizia, Shouwen Ma, Marting Strauch, Anja Nissler and me who started to discuss ways to integrate this heterogeneous data in order to make it usable (see merging heterogeneous data for our solution). We would then build the R code of what we discussed, with Shouwen performing almost all of the programming of this initial version of DoOR which was published in 2010 [1].
In 2014 we put the DoOR code on GitHub and started to work on a major update which included rewriting major parts of the code, addition of several new features and the integration of new data and eventually resulted in the publication of DoOR 2.0 [2].
Part of the DoOR 2.0 update was also to ask authors to contribute their original data, especially in the cases where our initial data had to be extracted from plots. It is worth mentioning that while the majority of colleagues was very responsive and helpful, there were cases where we failed to get any response of authors or where data could not be provided as it was completely or partially lost. This underlines how important it is to make use of reliable data-repositories and to push data availability policies e.g. by journals.
🔗 Two Packages
The DoOR project consists of two packages, DoOR.data and DoOR.functions. While the first mainly provides the raw data-sets, the latter performs the processing i.e. the actual merging process, data import and export, data analysis and visualization. We chose this structure to be able to update both, data and functions independently. This also gives the possibility to easily create new “DoORs” by providing DoOR.functions with another heterogeneous data-set like e.g. olfactory responses from another species or maybe something completely different.
🔗 Installation & Loading Data
To install the latest version of both packages from the master branch on GitHub run:
devtools::install_github("ropensci/DoOR.functions")
devtools::install_github("ropensci/DoOR.data")
and then load the packages
library(DoOR.functions)
library(DoOR.data)
and call the load_door_data() function to load all data to the current workspace.
🔗 DoOR.data
The raw data in DoOR is stored in data.frames that are named according to the functional unit (i.e. OSN) they correspond to. There are a few header columns containing different chemical descriptors followed by data columns named according to the study these data were measured in. The example below contains all data that were measured from OSNs that express the Or22a olfactory receptor.
> head(Or22a)
  Class               Name                    InChIKey   CID       CAS Hallem.2006.EN
1  <NA>                sfr                         SFR   SFR       SFR              4
2 other              water XLYOFNOQVPJJNP-UHFFFAOYSA-N   962 7732-18-5             NA
3 amine ammonium hydroxide VHUUQVKOLVNVRT-UHFFFAOYSA-N 14923 1336-21-6             17
4 amine         putrescine KIDHWZJUCRJVML-UHFFFAOYSA-N  1045  110-60-1             16
5 amine         cadaverine VHRGRCVQAFMJIZ-UHFFFAOYSA-N   273  462-94-2             17
6 amine            ammonia QGZKDVFQNNGYKY-UHFFFAOYSA-N   222 7664-41-7             NA
  Dobritsa.2003.EN Stensmyr.2003.WT Schmuker.2007.TR Pelz.2006.ALEC50 Pelz.2006.AntEC50
1               NA               NA                4               NA                NA
2               NA               NA               NA               NA                NA
3               NA               NA               NA               NA                NA
4               NA               NA                3               NA                NA
5               NA               NA               NA               NA                NA
6               NA               NA                3               NA                NA
  Pelz.2005.ALnmr Pelz.2005.Antnmr Gabler.2013.AL Bruyne.2001.WT Bruyne.2010.WT
1               0                0              0              4              0
2              NA               NA             NA             NA             NA
3              NA               NA             NA             NA             NA
4              NA               NA             NA             NA             NA
5              NA               NA             NA             NA             NA
6              NA               NA             NA             NA             NA
  Marshall.2010.WT Hallem.2004.EN Hallem.2004.WT
1            0.000          6.186          6.915
2           60.571             NA             NA
3           44.286             NA             NA
4           28.000             NA             NA
5               NA             NA             NA
6               NA             NA             NA
DoOR.data also contains the pre-computed consensus data-sets (merged raw data) door_response_matrix and door_response_matrix_non_normalized and some additional meta data.
🔗 DoOR.functions
DoOR.functions provides the algorithm to compute the consensus matrix by merging the raw response data, as well as some data analysis & visualization (dplot_*()) functions and some smaller helper functions. I’ll give some basic examples below, for a more detailed documentation please see the three vignettes that come with the package (DoOR.functions, DoOR tools & DoOR visualizations).
🔗 Merging Heterogeneous Data
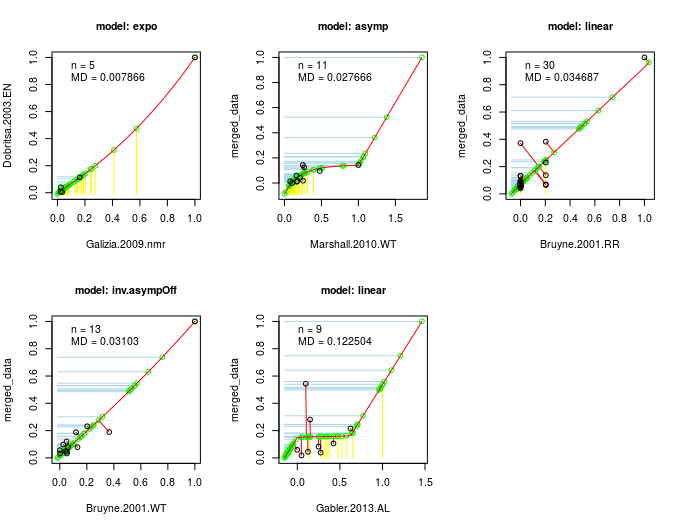
This algorithm is the actual core of DoOR. The computation of the consensus response matrix is based on the assumption that, no matter the recording technique (spikes, calcium imaging, …) or the differences in the recording setups, the same monotonic relationship between odor-responses applies: if odor A is a weaker ligand for an OSN than ligand B, this should be true no matter the recording technique. We then take two data-sets of a given OSN that have at least a minimal overlap of odors tested, rescale each of these [0,1] and plot the overlapping odor-responses against each other. We then fit a function onto the overlapping responses (picking the best fitting one of eight different functions). Next we project the responses that were measured only in one of the studies onto this function and measure the distance of all points along the function. This data is the again rescaled [0,1] which gives us a new merged data-set. Then we perform the same step between the merged data-set and the next raw data-set and iterate this process until all data is included. As the sequence of merges has an influence on the final data, wherever possible we compute all possible sequences of fits and compared how good the final consensus data fitted all raw data.
🔗 Working With Response Data
You don’t have to perform the merging process every time you use DoOR, as DoOR.data contains a pre-computed version of it (door_response_matrix). But you might have your own data that you want to add to DoOR or you might want to exclude certain data from the merging process. In that case you can easily modify the DoOR data.frames (i.e. Or22a) and then initiate a complete merging process by calling create_door_database() or just update the receptor you modified via update_door_database('Or22a', permutation = FALSE).
If you are interested in the raw response values of specific odors you can use get_responses() to list these across all studies:
# here we use trans_id() to translate odor names into InChIKeys for the lookup
odors  <- trans_id(c("carbon dioxide", "isopentyl acetate"), from = "Name")
# then we call get_responses()
responses <- get_responses(odors)
# and remove NAs
responses <- na.omit(responses)
head(responses)

ORs          studies                        Odor Response
25 ac3B Marshall.2010.WT CURLTUGMZLYLDI-UHFFFAOYSA-N       13
29  ac4 Marshall.2010.WT CURLTUGMZLYLDI-UHFFFAOYSA-N       -1
30  ac4      Yao.2005.WT MLFHJEHSLIIPHL-UHFFFAOYSA-N        1
33 Or1a   Kreher.2008.EN CURLTUGMZLYLDI-UHFFFAOYSA-N        4
34 Or1a   Kreher.2008.EN MLFHJEHSLIIPHL-UHFFFAOYSA-N       21
36 Or2a   Kreher.2008.EN MLFHJEHSLIIPHL-UHFFFAOYSA-N       73
Please refer to the following vignettes for more tools and for a more detailed description of the above functions: DoOR.functions, DoOR tools
🔗 Visualizing Data
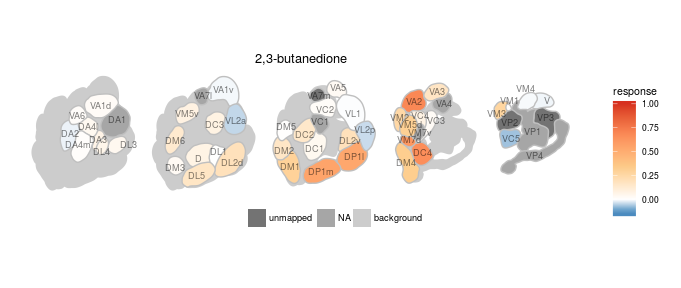
We created various plotting functions to visualize the data in DoOR. All of the visualizations depend on ggplot2. One very important task of DoOR is to visualize the ensemble responses that odors elicit across the sensory neurons of Drosophila. plot_al_map() does this job by mapping the responses onto a color-coded map of the antennal-lobe. The antennal-lobe is the first odor-processing center in the insect brain. All OSNs of the same class converge onto spherical sub-structures (glomeruli) of the antennal lobe, thus the differential activity across glomeruli corresponds to the ensemble response across OSNs.
Here we plot the ensemble response of 2,3-butanedione, the odor that gives margarine its buttery smell:
dplot_al_map("QSJXEFYPDANLFS-UHFFFAOYSA-N", base_size = 8)
Of course there are options to theme the output, either by passing parameters to the function or by adding ggplot2 functions to the call:
dplot_al_map("QSJXEFYPDANLFS-UHFFFAOYSA-N", tag = "", main = "",
  legend = FALSE, scalebar = FALSE)
does the same as
dplot_al_map("QSJXEFYPDANLFS-UHFFFAOYSA-N", tag = "", legend = FALSE) +
  ggplot2::theme(legend.position  = "none") +
  ggplot2::ggtitle('')
DoOR comes with more built-in visualizations, please see the visualization vignette for a complete list.
🔗 The DoOR Website
The DoOR web-site is an export of the odor & OSN profiles with some background information and links to other databases. It provides a quick overview over the latest “olfactome” and can be found at https://neuro.uni-konstanz.de/DoOR.
🔗 Contribute!
- You published a paper with odor responses or know a study we missed?
- Open an issue.
- You want to build DoOR for other organisms?
- Just fork
DoOR.functionsand start adapting it to your needs. We are happy to assist!
- Just fork
🔗 Acknowledgements
A lot of people contributed to DoOR over the last year. First I would like to thank Remko Duursma and Scott Chamberlain for their reviews. Scott already gave important feedback before the initial submission and helped a lot during the whole review process.
Giovanni Galizia and the whole team Shouwen Ma, Martin Strauch, Anja Nissler that was involved in developing DoOR in the first place. Especially Shouwen for digging through all the data and writing the initial code.
I am extremely grateful to all authors that contributed their original data to the project, even if that meant to dig out almost forgotten hard-disks (DoOR.data::unique(door_dataset_info$study)). I’d like to thank Veith Grabe for contributing the antennal lobe model for the dplot_al_map() function, Eduard Szöcs for pointing me to his webchem package that saved me days and weeks of work when translating chemical identifiers. I want to thank Greg Jefferis for suggesting to put the DoOR code onto GitHub in the first place. And I am thankful for all the people that use DoOR in their research and provide us with their feedback.
Galizia, C.G., Münch, D., Strauch, M., Nissler, A., Ma, S., 2010. Integrating heterogeneous odor response data into a common response model: A DoOR to the complete olfactome. Chem. Senses 35, 551–563. https://doi.org/10.1093/chemse/bjq042 ↩︎
Münch, D., Galizia, C.G., 2016. DoOR 2.0 - Comprehensive Mapping of Drosophila melanogaster Odorant Responses. Sci. Rep. 6, 21841. https://doi.org/10.1038/srep21841 ↩︎
Filed under
Suggest an edit
Open a pull request
