
Tuesday, December 4, 2018 From rOpenSci (https://ropensci.org/blog/2018/12/04/spatsoc/). Except where otherwise noted, content on this site is licensed under the CC-BY license.
spatsoc is an R package written by Alec Robitaille, Quinn Webber and Eric Vander Wal of the Wildlife Evolutionary Ecology Lab (WEEL) at Memorial University of Newfoundland. It is the lab’s first R package and was recently accepted through the rOpenSci onboarding process with a big thanks to reviewers Priscilla Minotti and Filipe Teixeira, and editor Lincoln Mullen.
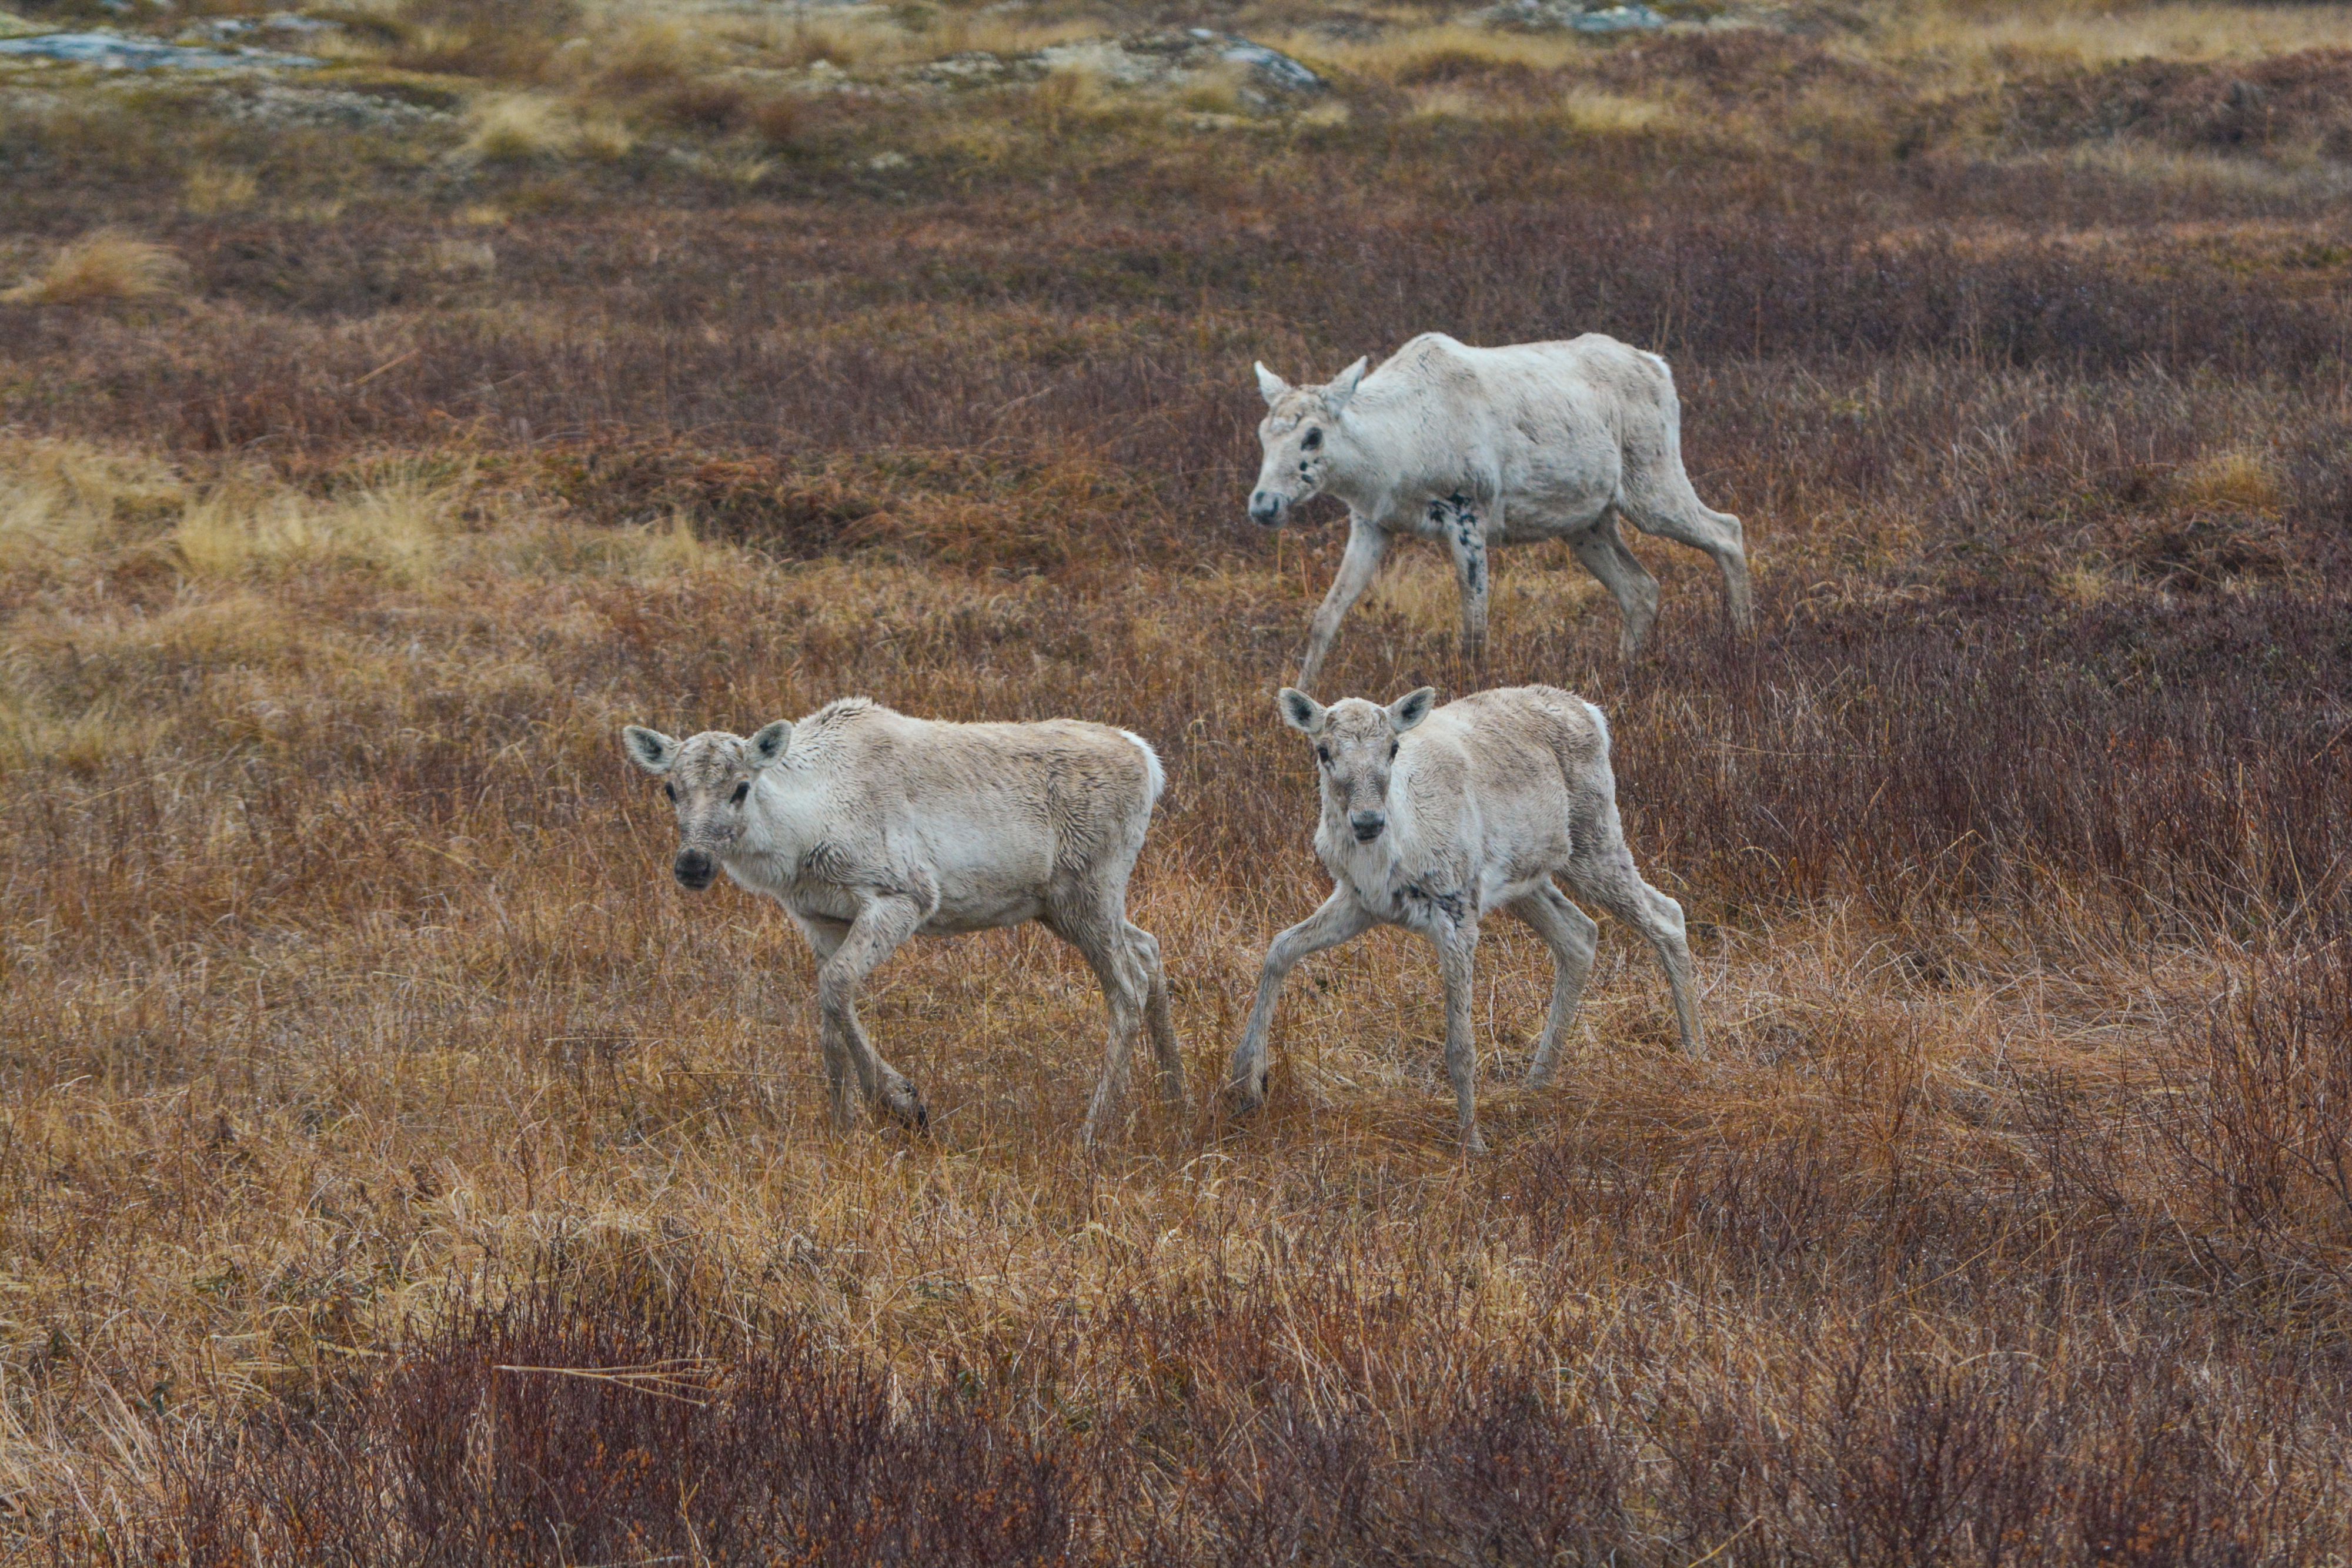
spatsoc started as a single function (what would eventually become group_pts) written by Alec in 2017 to help answer some of the questions that Quinn and Eric were asking about how animal social structure is related to spatial processes. These ideas were originally proposed by Quinn and Eric in their recent review paper 1. After our ideas were published, we began using this early function to determine when GPS collared caribou (Rangifer tarandus) in Newfoundland were recorded within 50 m of one another, within 5 minutes. This spatiotemporal grouping allowed us to build and analyze social association networks with asnipe and igraph. Using animal telemetry data with social network analysis allowed us to draw new insights from a long term movement dataset.
🔗 Social network analysis
Social network analysis (SNA) is a powerful tool for measuring associations and relationships between individuals with implications for disease transmission, species interactions and community structure. SNA uses graph theory and networks to reconstruct social structures, where nodes represent individuals and edges represent the relationships or associations between them. Social networks built from spatsoc results are explicitly association networks, with the edges being defined by the spatiotemporal grouping of relocations as opposed to observed social interactions. Spiegel et al. 2 showed that combining social network analysis with telemetry data of sleepy lizards can reveal insights about social structures in which the individuals and their behaviours that shape it are otherwise difficult to directly observe.
🔗 Animal telemetry data
The quantity and accessibility of animal movement data is increasing. A number of recent articles have suggested we are in a “golden age of animal tracking science” with large, extensive movement datasets being collected for a diversity of species, many of which are publicly available 3. Movebank is a global data archive of animal movement data, with over 800 taxa and 1 billion relocations. It also hosts an archive of published datasets with accompanying DOI and licenses used in over 100 publications, backed by a formal review process to ensure data quality.
Animal telemetry technology is improving rapidly, as battery systems improve and sensors become smaller. Deployments of more advanced biologging devices on animals means less frequent captures to redeploy and more continuous data. ICARUS (the International Cooperation for Animal Research Using Space) is a collaborative project using GPS and 3D accelerometry loggers powered by solar panels and rechargeable batteries to produce continuous, high temporal and spatial resolution data. The goal of ICARUS is to use this data to better understand movement of animals and selecting forces that act on individuals and contribute to our understanding of health, disease epidemics and even potentially predict volcanoes and earthquakes!
spatsoc allows us to answer the question: when and where are individuals close to each other?
The spatiotemporal grouping of spatsoc can lead to many outcomes. We developed it to build proximity based social association networks from GPS relocation data but others may use it to measure species interactions or shared space use among con- or hetero-specifics. We are not restricted to dyadic interactions since spatsoc groups relocations for all individuals in space and time. spatsoc’s flexible functions let user define spatial and temporal grouping thresholds.
🔗 Package installation
Install the development version with remotes.
remotes::install_github('ropensci/spatsoc')

# or CRAN
install.packages('spatsoc')
🔗 Temporal and point based spatial grouping
For this example, we will use bison data from the “Dunn Ranch Bison Tracking Project” (Max Planck Institute and Nature Conservancy Missouri) available on Movebank here. We will import the downloaded data (CSV format) with data.table’s fread. This function is fast when data gets big and data.table is the required format for all DT arguments in spatsoc.
Note: to download the data from Movebank you will need to make an account and accept the terms of the data. We are only going to use a subset of the available data for this example and we have renamed the downloaded file to Bison.csv for brevity. Lastly, select “Add UTM coordinates” on the download page to ensure we have projected coordinates ready for spatsoc.
# Load packages
library(spatsoc)
library(data.table)

# Read data as a data.table
DT <- fread('Bison.csv')

# Cast the character column 'timestamp' as a POSIXct, saved as 'datetime'
# GMT/UTC timezone as specific in the data's README.txt
DT[, datetime := as.POSIXct(timestamp, tz = 'GMT')]

# Subset to 2015
DT <- DT[year(datetime) == 2015]

# Temporal grouping with threshold of 5 minutes
group_times(DT = DT, datetime = 'datetime', threshold = '5 minutes')

# Spatial grouping with threshold of 25 meters
group_pts(DT = DT, threshold = 25, id = 'individual_local_identifier',
          coords = c('utm-easting', 'utm-northing'), timegroup = 'timegroup')
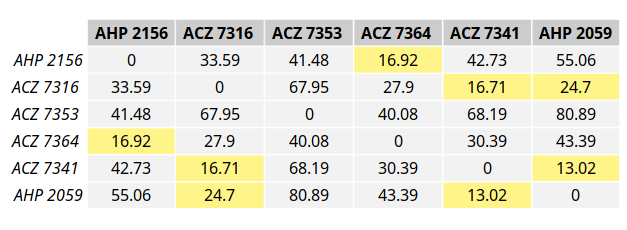
Behind the scenes, we are building a distance matrix and using the connected components to determine group membership.
library(igraph)
distMatrix <- as.matrix(dist(cbind(X, Y), method = "euclidean"))
graphAdj <- graph_from_adjacency_matrix(distMatrix <= threshold,
                                        mode = 'undirected', diag = FALSE)
groups <- clusters(graphAdj)$membership
A distance matrix measures the spatial distance between all of the individuals. The spatial distance threshold defined by the user is used to turn the distance matrix into a boolean matrix.
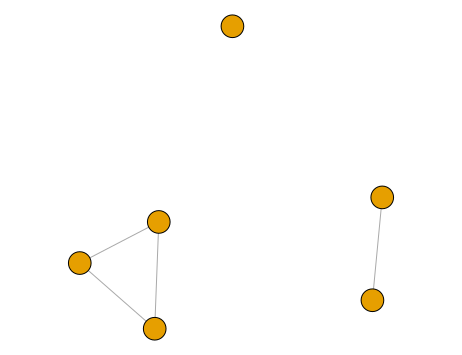
This matrix is then passed to igraph to build a graph, and the connected components are extracted. The connected components represent the distinct, separate subgraphs that make up a graph. In this case, there are three connected components representing our spatiotemporal groups.
🔗 Reflecting on the process
spatsoc was submitted to rOpenSci on July 16 2018 and accepted on October 26 2018. Based on feedback during the review process, the package documentation and usability were greatly improved. The rOpenSci onboarding process represented a different standard than CRAN, where test coverage, useful documentation and goodpractice were just as important as getting 0 errors | 0 warnings | 0 messages. We really appreciated the common goal of improving the package shared by package authors, rOpenSci reviewers, and editor.
The package building process gave us a better understanding of how the functions and packages we use in our analyses are built. Using powerful tools like unit testing and CRAN checks we could ensure our code was well written. Alec was really surprised how much he enjoyed writing unit tests, thinking of all the different ways things could fail and setting up the necessary framework to prevent it, returning useful warnings and errors when it did.
In the future: more packages! For personal use, for fun, and for sharing new methods and tools with the R community. The flexibility and power of the package as a fundamental unit of sharing functions (and data, projects, etc.). Next time, we will write unit tests and documentation as we go (hopefully!). We are looking forward to engaging in more collaboration opportunities in the R community through the rOpenSci onboarding process as authors and reviewers or less formally through Pull Requests or Issue Boards.
🔗 Resources
Check out the repository, contribute to open issues or open a new issue! We have written three vignettes and created a website using pkgdown. If the documentation and these resources still leave you with questions about using the package, please contact us or create an issue.
We are always open to chat about our ideas, the research we are currently doing with spatsoc, and the research we plan to do in the future, so please let us know if you have any questions.
🔗 References
1: Webber, Q. M., & Vander Wal, E. (2018). An evolutionary framework outlining the integration of individual social and spatial ecology. Journal of Animal Ecology.
2: Spiegel, O., Sih, A., Leu, S. T., & Bull, C. M. (2018). Where should we meet? Mapping social network interactions of sleepy lizards shows sex-dependent social network structure. Animal Behaviour.
3: Kays, R., Crofoot, M. C., Jetz, W., & Wikelski, M. (2015). Terrestrial animal tracking as an eye on life and planet. Science.
Filed under
Suggest an edit
Open a pull request
