
Tuesday, November 26, 2019 From rOpenSci (https://ropensci.org/blog/2019/11/26/rnassqs/). Except where otherwise noted, content on this site is licensed under the CC-BY license.
The United States Deparment of Agriculture National Agricultural Statistics Service (USDA-NASS) provides a wide range of agricultural data that includes animal, crop, demographic, economic, and environmental measures across a number of geographies and time periods. This data is available by direct download or queriable via the Quick Stats interface. While the Quick Stats tool puts a large amount of data into the hands of users, the interface can be frustrating, especially when trying to access more than 50,000 records or hoping to automate downloading data when new data is released. I developed rnassqs as a solution to these frustrations. rnassqs provides a simple R interface for the Quick Stats API. By iterating over a set of parameters, R users can make processing NASS data reproducible and automated.
🔗 What is rnassqs and what can it do for you?
Succinctly, rnassqs will let you write an R script to download data from the Quick Stats database. Accessing the Quick Stats API requires a key, which can be requested here:
https://quickstats.nass.usda.gov/api
The rnassqs package can be installed from CRAN or from GitHub:
# Install from CRAN
install.packages("rnassqs")

# Install from github
devtools::install_github("ropensci/rnassqs")

# Add the API key
nassqs_auth("<your api key>") # just for this session

# To add the API key permanently, add
#     NASSQS_TOKEN="<your api key>"
# to your .Renviron file, which can be accessed via
#     usethis::edit_r_environ()
Data can then be downloaded by selecting query parameters. For example, the following downloads corn yields from 2017 onward for counties in Virginia and Pennsylvania
df <- nassqs(commodity_desc = "CORN",
             year__GE = 2017,
             agg_level_desc = "COUNTY",
             state_alpha = c("VA", "PA"),
             statisticcat_desc = "YIELD")
🔗 A real world use case
In a current working paper with coauthors Michael Brady and Kirti Rajagopalan, all of us at Washington State University, I investigate the relationship between climate and irrigated agriculture in the western United States. USDA-NASS data is a crucial component of the analysis, but can be complex to understand and download. For example, the Census of Agriculture asks farmers to report the number of acres in three different categories:
- land use (crop, pasture, wood, or other)
- harvested status (harvested or not)
- irrigation status (irrigated or not)
However, the census does not ask for acres under the full combination of land uses, so they must be reconstructed to the extent possible. This can be done manually, but is tedious and subject to possible errors. Instead, the full set of acres reported can be downloaded using rnassqs. A good strategy is to define the parameters for a set of queries that won’t change, and then add the specific parameters iteratively. In this case, we can iterate over the type of acres but keep the set of geographies and years the same for each query. To keep data sizes small, we focus on Yakima County in Washington State.
acre_params <- list(
  sector_desc = "ECONOMICS",
  commodity_desc = "AG LAND",
  agg_level_desc = "COUNTY",
  unit_desc = "ACRES",
  domain_desc = "TOTAL",
  domaincat_desc = "NOT SPECIFIED",
  county_name = "Yakima",
  state_alpha = "WA",
  year__GE = 1997,
  year__LE = 2017)
Then, specifying the specific parameters as a list to be iterated over:
var_params <- list(
  cropland = list(
    class_desc = "CROPLAND",
    prodn_practice_desc = "ALL PRODUCTION PRACTICES"
  ),
  pastureland = list(
    class_desc = "PASTURELAND, (EXCL CROPLAND & WOODLAND)",
    prodn_practice_desc = "ALL PRODUCTION PRACTICES"
  ),
  woodland = list(
    class_desc = "WOODLAND",
    prodn_practice_desc = "ALL PRODUCTION PRACTICES"
  ),
  other = list(
    class_desc = "(EXCL CROPLAND & PASTURELAND & WOODLAND)",
    prodn_practice_desc = "ALL PRODUCTION PRACTICES"
  ),
  cropland_harvested = list(
    class_desc = "CROPLAND, HARVESTED",
    prodn_practice_desc = "ALL PRODUCTION PRACTICES"
  ),
  cropland_harvested_irrigated = list(
    class_desc = "CROPLAND, HARVESTED",
    prodn_practice_desc = "IRRIGATED"
  ),
  irrigated = list(
    class_desc = "ALL CLASSES",
    prodn_practice_desc = "IRRIGATED"
  ),
  irrigated_excl_cropland_harvested = list(
    class_desc = "(EXCL HARVESTED CROPLAND)",
    prodn_practice_desc = "IRRIGATED"
  )
)
Now to actually download the data:
data_list <- lapply(names(var_params), function(v) {
  # create a new parameter list from the base list
  params <- acre_params

  # Assign parameters for the specific variable in v
  vp <- var_params[[v]]
  for(p in names(vp)) { params[[p]] <- vp[[p]] }

  # Download the data
  d <- nassqs(params)
  remove(params)

  # Assign a variable for ease of tracking
  d$variable <- v

  # Add the data.frame to the list of data
  d
})

# Convert the list of data.frames to one data.frame
df <- dplyr::bind_rows(data_list) # with 'dplyr'
#df <- data.table::rbindlist(data_list) # with 'data.table'
#df <- do.call(rbind, data_list) # with base R
We can present a compact table of acres using tidyr:
library(dplyr)
library(tidyr)
df %>%
  select(variable, year, Value) %>%
  spread(key = year, value = Value)
which generates a data.frame that looks like:
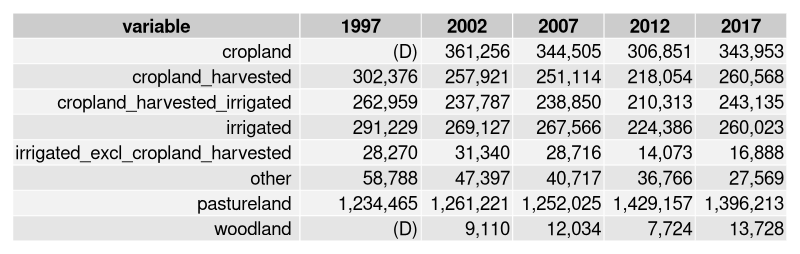
An important note: nassqs() retains the character type
of the Value column because there are often missing value
codes returned. Here we can see that cropland and woodland
have missing codes for 1997. Before doing any calculations
we want to convert the values to numeric, but also take note
of missing codes to help decide how to handle missing values.
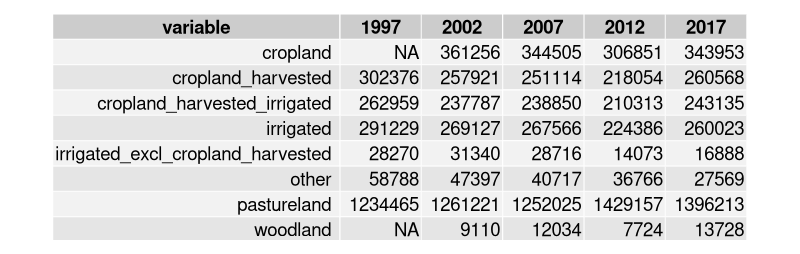
In this case, we convert them to NA and can convert values to
numeric with
df %>%
  select(variable, year, Value) %>%
  transmute(
    variable,
    year,
    value = as.numeric(gsub(",", "", Value))) %>%
  spread(key = year, value = value)
which generates a data.frame with values converted to numeric:
🔗 Developing and submitting your first R package to rOpenSci
I began development on rnassqs in the fall of 2017 when I was confronted with having to manually download many different variables for a number of different counties and years. Having never developed an R package before, I found great use in two sources:
- Hadley’s R Packages
- The httr package’s vignette Best practices for API Packages
After a year or so of unofficial releases and work, Hao Ye suggested I submit the package to rOpenSci. It’s hard to overstate the value of having two friendly and thorough reviewers (Adam Sparks and Neal Richardson) pour over your package in detail. Their comments were extremely helpful (here is the review thread) and greatly improved the package in a number of ways:
- Testing: I initially had poorly organized and confusing tests, largely because I had little experience. Luckily one Neal Richardson wrote the httptest package that makes it easier to make mock API calls to test without making the actual call to the API service, which becomes important for passing CRAN checks.
- Documentation: As the author of functions, it’s hard to document from the perspective of someone who is new to the function. The reviews provided that perspective and made the documentation much clearer.
- Simplicity: The rnassqs code base was unecessarily complicated when I initially submitted it. It was much cleaner, easier to understand, and easier to maintain by the time the review was finished.
In addition, a benefit I consider on par with the above improvements to rnassqs was the experience of interacting with reviewers. Both were friendly and helpful and contributed time and energy far beyond what I expected. Their example served as a strong cultural norm to guide my work as a reviewer for a later package.
🔗 In closing
In summary, there are two lessons in particular I hope to retain for future work:
- On the scale of simple but rigid to flexible but complex, I tend to lean toward the latter too early, trying to abstract and complicate to avoid repeating myself. I think my work would be cleaner, faster, and more coherent if I kept a more narrow focus and thought at a meta level about package design before diving in to write functions that encapsulate all possible use functions.
- The benefit of other perspectives cannot be overstated. Getting feedback earlier could have avoided unecessarily complicating the package code.
If you’re interested in learning more about rnassqs, the
package documentation provides
an introduction and guide to use as well as a
vignette with detailed examples.
A goal going forward is to improve the ease of developing queries, which remains
difficult, requiring an understanding of the peculiarities of the Quick Stats
database. Some convenience functions like nassqs_acres() and nassqs_yields()
may help with that, but there must be better ways. The rnassqs
repository on GitHub is the best place to
file issues or feature requests, both of which are very welcome.
🔗 Acknowledgements
Thank you to rOpensci reviewers Adam Sparks and Neal Richardson for their efforts and suggestions which greatly improved the package. Thanks as well to contributors to rnassqs, much appreciated!
Filed under
Suggest an edit
Open a pull request
