
Tuesday, December 22, 2020 From rOpenSci (https://ropensci.org/blog/2020/12/22/phonfieldwork-phonetic-fieldwork-and-experiments/). Except where otherwise noted, content on this site is licensed under the CC-BY license.
🔗 Science craft
As a field linguist, I have spent a lot of time working in villages in the Caucasus, collecting audio from speakers of indigenous languages. The processing of such data involves a lot of time-consuming tasks, so during my field trips I created my own pipeline for data collection. I wrote a number of scripts using different programming languages for automatic renaming, merging, and preannotation of files, making backups, visualizing some data, etc. My method consisted of a combination of solutions developed on the fly to solve specific, independent tasks, without thinking of the future.
This became a problem when I wanted to pass on my knowledge to my students. Not all of them were familiar with all of the programming languages I used, some of the code had become outdated, and some code did not work properly on all operating systems.
The practical side of linguistic research is often neglected. Linguists rely on manual and makeshift solutions for working with data and simultaneously write similar scripts, reinventing the same wheel as part of the process. The few existing software programs are undercited: there are a lot of papers presenting data processed in R,1 Praat,2 ELAN3 or other software, which do not cite them. Methodologically oriented papers are valued mainly for their theoretical implications.
Recent years have seen increased attention to best practices in linguistic data management, for example through the introduction of Cross-Linguistic Data Formats.4 I think the time is also ripe to pay more attention to what I like to call science craft – improving the methods for curating linguistic data, and allowing future generations of linguists to benefit from our experience.
That is why I decided to create a toolkit for phonetic researchers in the form of an R package, phonfieldwork: it is written using one programming language, and easy to use for non-coders and people who are not familiar with R.
Below is an overview of its main functions.
🔗 phonfieldwork
Most phonetic research consists of the following steps:
- Formulate a research question. Think of what kind of data is necessary to answer this question, what is the appropriate amount of data, what kind of annotation you will do, what kind of statistical models and visualizations you will use, etc.
- Create a list of stimuli.
- Elicit the list of stimuli from speakers who signed an Informed Consent statement, agreeing to participate in the experiment and to be recorded on audio and/or video. Keep an eye on the recording settings: the sampling rate, resolution (bit), and number of channels should be the same across all recordings.
- Annotate the collected data.
- Extract the collected data.
- Create visualizations and evaluate your statistical models.
- Report your results.
- Publish your data.
The phonfieldwork package is created for helping with items 3, 5, and 8, and partially 4. If you are interested in the whole pipeline please read the whole Get started section in the package documentation. Below I will introduce some specific features.
🔗 What can be done with phonfieldwork?
First let’s load the package:
library(phonfieldwork)
🔗 Create a presentation based on a list of stimuli
It is easier to collect your stimuli with a presentation. In order to create it you need a list of stimuli (as an example I will use a simple vector, but of course it can be a column from .csv or .xlsx files):
create_presentation(stimuli = c("tip", "tap", "top"),
                    output_file = "first_example",
                    output_dir = "...path/to/your/folder")
As a result, a file first_example.html will appear in the output folder (here is an example of a such file5). It is also possible to add translations and even use images (see the documentation page).
🔗 Sound annotation formats
There was a goal to be able to convert multiple sound annotation formats into data.frame format, so you can find a whole bunch of functions that serve this purpose:
textgrid_to_df(system.file("extdata", "test.TextGrid", package = "phonfieldwork"))
   id time_start   time_end content tier       tier_name        source
1   1 0.00000000 0.01246583            1       intervals test.TextGrid
6   1 0.00000000 0.01246583            2 empty_intervals test.TextGrid
2   2 0.01246583 0.24781914       t    1       intervals test.TextGrid
7   2 0.01246583 0.24781914            2 empty_intervals test.TextGrid
11  1 0.01246583 0.01246583       t    3          points test.TextGrid
3   3 0.24781914 0.39552363       e    1       intervals test.TextGrid
8   3 0.24781914 0.39552363            2 empty_intervals test.TextGrid
12  2 0.24781914 0.24781914       e    3          points test.TextGrid
4   4 0.39552363 0.51157715       s    1       intervals test.TextGrid
9   4 0.39552363 0.51157715            2 empty_intervals test.TextGrid
13  3 0.39552363 0.39552363       s    3          points test.TextGrid
5   5 0.51157715 0.65267574       t    1       intervals test.TextGrid
10  5 0.51157715 0.65267574            2 empty_intervals test.TextGrid
14  4 0.51157715 0.51157715       t    3          points test.TextGrid
- convert ELAN
.eaffiles; see also the FRelan package by Niko Partanen
eaf_to_df(system.file("extdata", "test.eaf", package = "phonfieldwork"))
   tier id content       tier_name tier_type time_start time_end   source
9     1  1               intervals     praat      0.000    0.012 test.eaf
10    2  1         empty_intervals     praat      0.000    0.012 test.eaf
11    1  2       t       intervals     praat      0.012    0.248 test.eaf
12    2  2       C empty_intervals     praat      0.012    0.248 test.eaf
1     1  3       e       intervals     praat      0.248    0.396 test.eaf
2     2  3       V empty_intervals     praat      0.248    0.396 test.eaf
3     1  4       s       intervals     praat      0.396    0.512 test.eaf
4     2  4       C empty_intervals     praat      0.396    0.512 test.eaf
5     1  5       t       intervals     praat      0.512    0.652 test.eaf
6     2  5       C empty_intervals     praat      0.512    0.652 test.eaf
7     1  6               intervals     praat      0.652  300.000 test.eaf
8     2  6         empty_intervals     praat      0.652  300.000 test.eaf
- convert EXMARaLDA
.exbfiles
exb_to_df(system.file("extdata", "test.exb", package = "phonfieldwork"))
  tier id content tier_name tier_type tier_category tier_speaker time_start
3    1  1       t     X [v]         t             v         SPK0 0.06908955
1    1  2       e     X [v]         t             v         SPK0 0.24989836
5    1  3       s     X [v]         t             v         SPK0 0.38072750
7    1  4       t     X [v]         t             v         SPK0 0.40424735
4    2  1       C     X [v]         a             v         SPK0 0.06908955
2    2  2       V     X [v]         a             v         SPK0 0.24989836
6    2  3       C     X [v]         a             v         SPK0 0.38072750
8    2  4       C     X [v]         a             v         SPK0 0.40424735
   time_end   source
3 0.2498984 test.exb
1 0.3807275 test.exb
5 0.4042473 test.exb
7 0.6526757 test.exb
4 0.2498984 test.exb
2 0.3807275 test.exb
6 0.4042473 test.exb
8 0.6526757 test.exb
- convert subtitles
.srtfile
srt_to_df(system.file("extdata", "test.srt", package = "phonfieldwork"))
  id content time_start time_end   source
0  1       t      0.013    0.248 test.srt
1  2       e      0.248    0.396 test.srt
2  3       s      0.396    0.512 test.srt
3  4       t      0.512    0.653 test.srt
- convert Audacity
.txtfile
audacity_to_df(system.file("extdata", "test_audacity.txt", package = "phonfieldwork"))
  time_start  time_end content            source
1  0.2319977 0.3953891    sssw test_audacity.txt
There is also an option to work with .flextext files from FLEx, but since this is not relevant for phonetics, I will skip this part.
🔗 Sound preannotation
The sound annotation process takes a lot of time and in most cases it is really boring. Because of this boredom annotators make mistakes during the annotation process. In order to prevent it phonfieldwork provides a bunch of functions that preannotate your sound files (annotate_textgrid(), create_subannotation() and create_empty_textgrid()). A detailed example would be too large to put in a blog post (you can find it in the documentation). Here is a .gif (created with magick) that illustrates the whole process:
preserved780e169271fdbe7
As you can see, it is possible to create all the annotations in advance and leave the annotators with one task only: to move boundaries.
🔗 Sound visualization
Sound visualization is a common task that could be solved via different programs and R packages, but it can also be done with phonfieldwork:
file <- system.file("extdata", "test.wav", package = "phonfieldwork")
draw_sound(file)
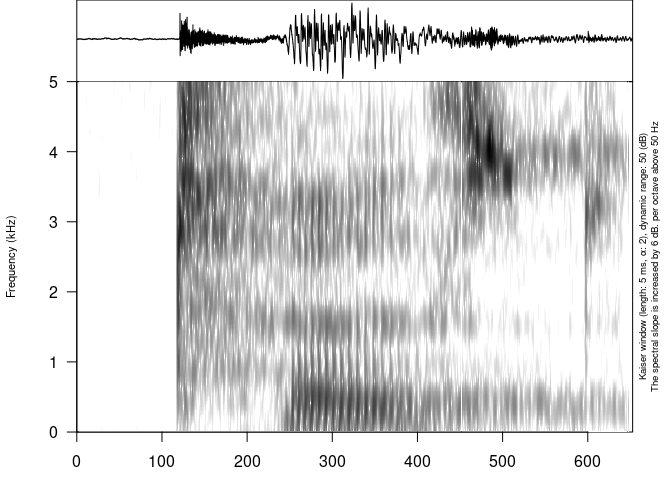
Example of an oscillogram and a spectrogram generated by the draw_sound() function
A feature specific to phonfieldwork, is that it is possible to zoom in to some part of the sound with a spectrogram (time in the zoom argument is represented in seconds):
draw_sound(file, zoom = c(0.2, 0.4))
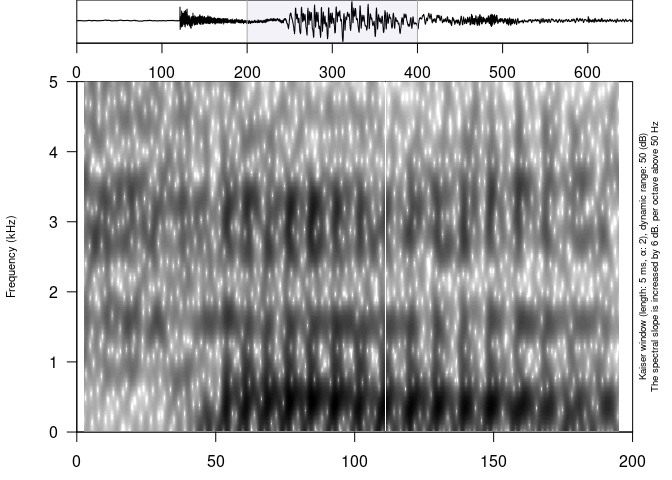
Usage of the zoom argument
It is also possible to visualize any sound annotation format that was converted to dataframe:
our_textgrid <- system.file("extdata", "test.TextGrid", package = "phonfieldwork")
draw_sound(file,
           annotation = textgrid_to_df(our_textgrid))
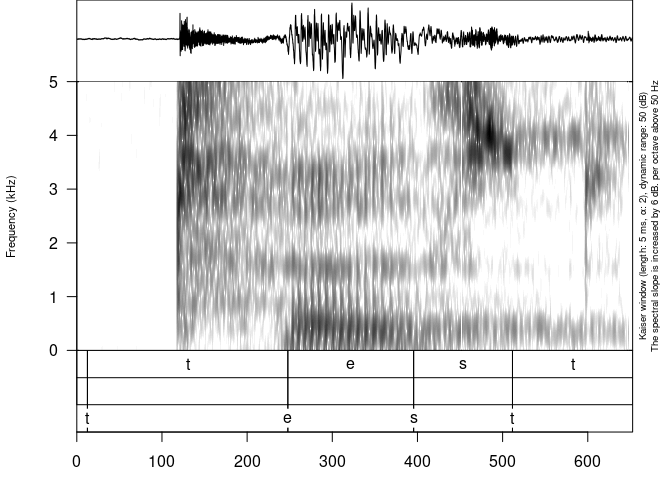
Usage of the annotation argument
🔗 Sound viewer
If you have folders with small sound chunks and their visualizations it is possible to create a sound viewer like this. This is done using the create_viewer() function:
create_viewer(audio_dir = ".../sounds/", # path to folder with sounds
              picture_dir = ".../pictures/", # path to folder with pictures
              table = df, # dataframe with additional information
              output_dir = "...", # where to store the result?
              output_file = "...") # how to name the result file?
If you are familiar with my package lingtypology7 for interactive linguistic map generation and API for typological databases, there is good news for you: it is possible to connect the two packages, creating an interactive map that shares the same hear and view buttons. Here is an example.
I really hope that this format will become a new tool for searching, analyzing and sharing phonetic data. However, there is always a risk that this tool can be misused, so please read the text about Ethical Research with phonfieldwork.
It is only a brief introduction into the phonfieldwork functionality, for more details read the whole Get started section in the package documentation.
🔗 Acknowledgements
I would like to thank
- my rOpenSci reviewers Jonathan Keane and Niko Partanen for their interesting comments and ideas;
- Melina Vidoni for being the package review editor;
- participants of seminars at the School of linguistics and Linguistic Convergence Laboratory at HSE, Moscow, where I first presented this package;
- my friends Vanya Kapitonov, Neige Rochant, and Samira Verhees for sharing their data and problems with me, which has made phonfieldwork better.
R Core Team. 2020. R: A Language and Environment for Statistical Computing. Vienna, Austria: R Foundation for Statistical Computing. https://www.R-project.org/. ↩︎
Boersma, P., and D. Weenink. 2020. “Praat: Doing Phonetics by Computer [Computer Program]. Version 6.1.35, Retrieved 5 December 2020 from https://www.praat.org/ ↩︎
Brugman, Hennie, Albert Russel, and Xd Nijmegen. 2004. “Annotating Multi-Media/Multi-Modal Resources with ELAN.” In LREC. ↩︎
Forkel, Robert, Johann-Mattis List, Simon J. Greenhill, Christoph Rzymski, Sebastian Bank, Harald Hammarström, Martin Haspelmath, and Russell D. Gray. 2018. “Cross-Linguistic Data Formats, Advancing Data Sharing and Re-Use in Comparative Linguistics.” Sci Data 5 (1): 1–10. ↩︎
It will not look nice on a phone, but you can use it on a PC or a tablet. ↩︎
Just change the
system.file()function to the path to the file. ↩︎Moroz, George. 2017. Lingtypology: Easy Mapping for Linguistic Typology. https://CRAN.R-project.org/package=lingtypology. ↩︎
Filed under
Suggest an edit
Open a pull request
