
Tuesday, September 28, 2021 From rOpenSci (https://ropensci.org/blog/2021/09/28/rspatialdata/). Except where otherwise noted, content on this site is licensed under the CC-BY license.
As two postgrad students on summer vacation but with no travel plans (during this global pandemic of course), we took up an internship at King Abdullah University of Science and Technology (KAUST) last summer and ended up collaborating on a really cool project with Paula Moraga! Did we mention that we worked in Saudi Arabia, while living in Australia? All is well when we have the internet.
We also ended up presenting our project at useR! 2021, and winning an award for the most outstanding lightning talk! So, keep reading to see how we got there!
Although there is so much data being collected in multiple disciplines and made openly available, it may be difficult to find, retrieve and utilize these resources. Spatial and spatio-temporal data are two data types which are collected and used in research across a diverse array of domains.
With the R programming language becoming increasingly popular among academics, researchers, and scientists, and because spatial data is easier to interpret when visualized, Paula thought it would be a great idea to create a repository of data sources and simple tutorials on how to retrieve and visualize spatial data using R, during our time as interns at KAUST.
This idea became rspatialdata - a collection of data sources and tutorials on downloading and visualising spatial data using R.
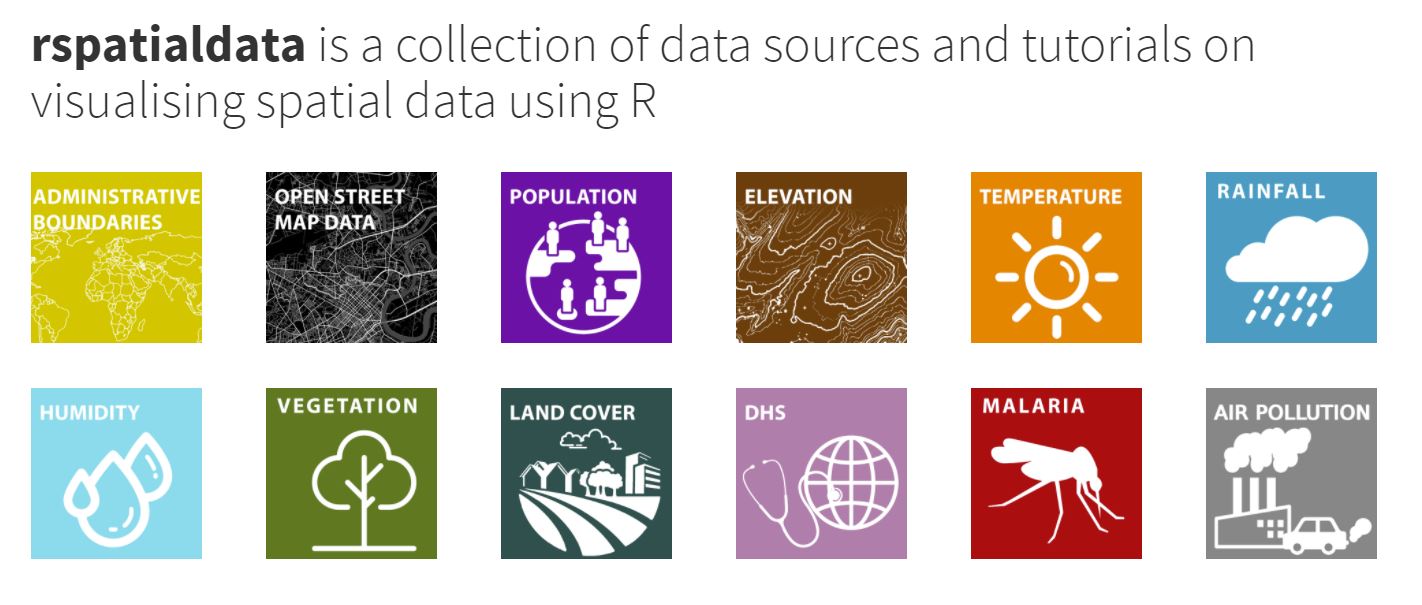
rspatialdata consists of a non-exhaustive list of R-packages which have been developed as clients for different spatio-temporal databases and APIs. It also consists of tutorials on how to use these R packages, understand the different types of spatial data objects available and create visualizations using them. After doing a lot of research, we managed to pick out a few R-packages which we were confident gave up-to-date data from reliable sources.
Coincidentally, much of what we picked out happened to be rOpenSci packages! We were amazed at how rich and easy to use most of these packages were. So here is our experience using those packages and some things we really enjoyed doing!
🔗 Downloading boundaries of countries using rnaturalearth
The rnaturalearth package (by Andy South) facilitates communication with Natural earth map data. It allows you to easily download and visualize boundaries of countries and boundaries of states within countries as well.
We used rnaturalearth to download the boundaries of countries in many of our tutorials - including our tutorials on elevation, rainfall and humidity.
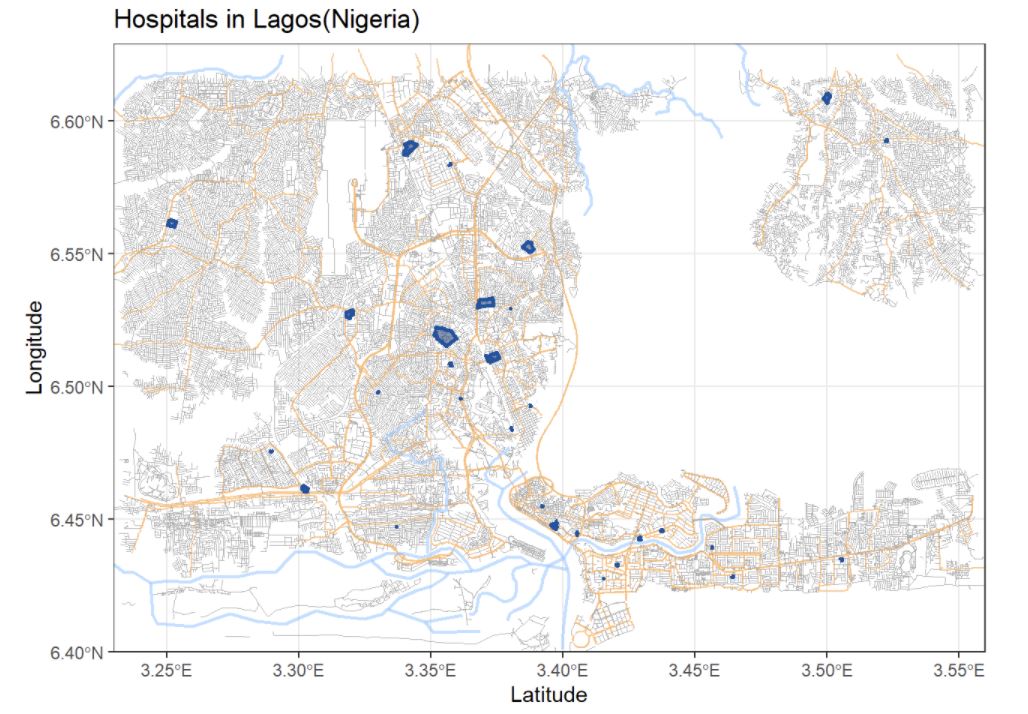
🔗 Visualizing hospitals in Lagos, Nigeria using osmdata
osmdata (by Mark Padgham, Robin Lovelace, Maëlle Salmon and Bob Rudis) is an R package for downloading spatial data from OpenStreetMap (OSM) - a very cool open source project. We were amazed at the huge variety of spatial features available to us! We were able to download spatial data about almost anything from amenities such as colleges, cinemas, hospitals and banks, to different types of highways and streets such as walking and bicycle paths, residential streets, motorways and service lanes.
We used the osmdata package to download and visualize hospitals in Lagos, Nigeria. Then we also downloaded spatial data for different types of highways, streets and waterways in Lagos, and created the following map entirely using data retrieved through osmdata!
Have a read through our Open Street Map data tutorial for a complete tutorial on how to install the osmdata package, find what spatial features are available, learn how to download these features and also create some cool maps (including an interactive one)!
🔗 Visualizing vegetation in Mongolia and land cover in Zimbabwe using MODIStsp
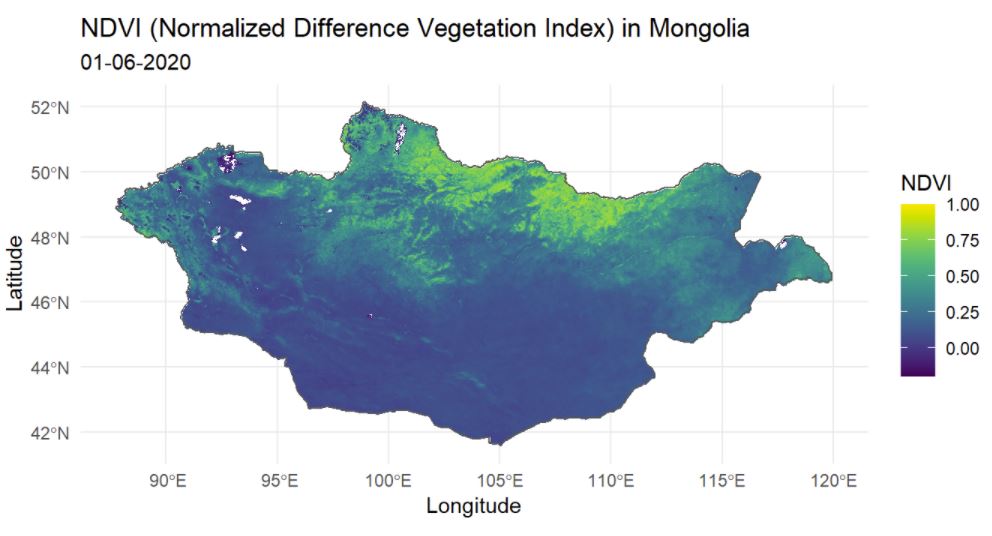
MODIS (Moderate Resolution Imaging Spectroradiometer) is an instrument aboard the NASA Terra and Aqua satellites, which orbit the entire Earth every 1-2 days, acquiring data at different spatial resolutions. The data acquired by MODIS describes features of the land, oceans and the atmosphere.
MODIStsp - an acronym for ‘MODIS Time Series Processing’ (by Lorenzo Busetto and Luigi Ranghetti), is an R package for downloading and pre-processing time series raster data from MODIS data products.
We used the MODIS Vegetation Index Products (NDVI and EVI), to visualize the Normalized Difference Vegetation Index in Mongolia.
We also used the MODIS Land Cover Type Products to visualize the land cover classification in Zimbabwe.
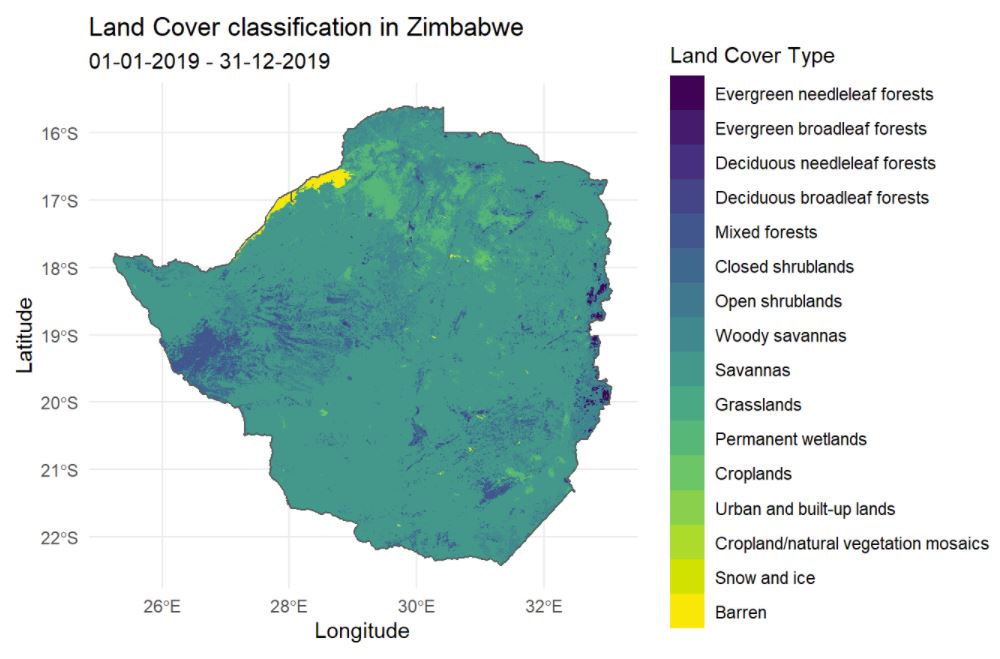
Using the MODIStsp package made it so much easier to find what data products were available and also directly download and save this data using R. Our Vegetation and Land Cover tutorials explain how we used the MODIStsp R package to download data and create cool maps.
🔗 Visualizing rainfall in Gansu, China and relative humidity in Western Australia using nasapower
nasapower (by Adam Sparks) is a client for the ‘NASA POWER’ global meteorology, surface solar energy and climatology data API, and aims to make it quick and easy to download climatology data for analysis, visualization, modeling and many other purposes.
We used the nasapower package to retrieve rainfall and humidity data, and it was such a simple task. We only had to submit the duration of data we needed along with the geographical location, and the package took care of all the hard work.
We downloaded relative humidity and rainfall data and then visualized the relative humidity in Western Australia and the rainfall in Gansu, China.
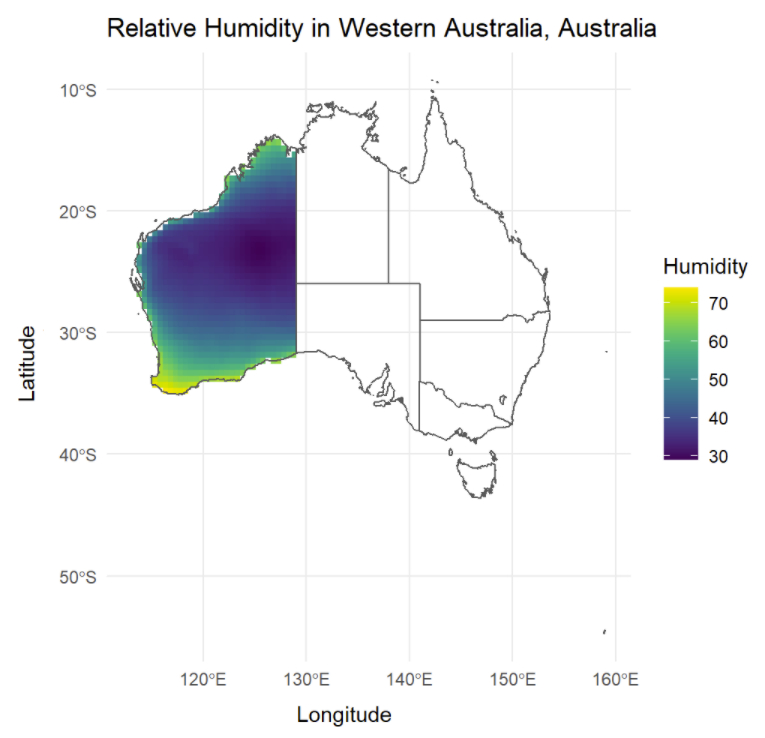
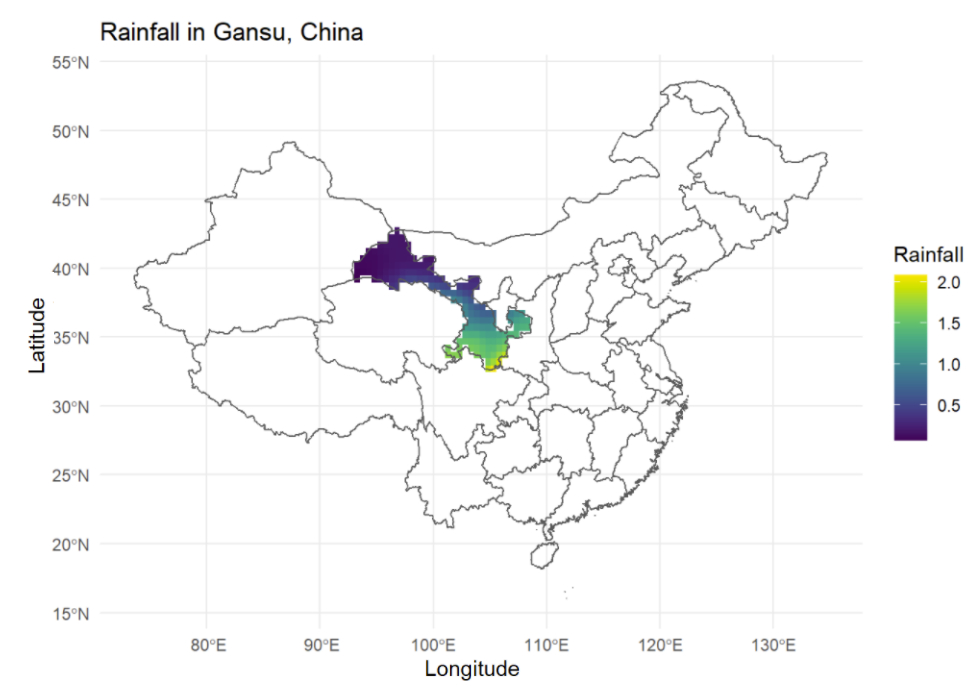
Take a look at our rainfall and humidity tutorials for a complete guide on how to use the nasapower package to download data and how to create cool visualizations using the data.
🔗 Retrieving demographic and health survey data using rdhs
The rdhs package (by OJ Watson and Jeff Eaton) is an API client for Demographic and Health Surveys (DHS) data - which is a collection of population, health, HIV and nutrition data from more than 400 surveys in over 90 countries. This data is considered to be sensitive and hence requires one to set up an account with DHS and request permission to access the data.
Although this may look like a tedious process, the rdhs package makes it very smooth by allowing us to test out the functions of the package using model data. So one could even start on the analysis while waiting for data access rights!
Read through our tutorial on Demographic and Health Surveys (DHS) for more details on how to use the rdhs package.
🔗 Interested in more?
Have a look at our administrative boundaries tutorial which runs you through creating outline maps of countries and their administrative divisions, our population tutorial which runs you through visualizing population estimates of countries using choropleth maps and cartograms, and our tutorials on elevation, temperature, malaria, and air pollution for ideas on how to download and visualize each respective property.
You just read through some of the things we enjoyed while creating rspatialdata. We are excited for you to try it out too! So give it a go, get creative with it, and let us know how you did!
Our goal for rspatialdata is not to be a comprehensive list of R packages or tutorials, but to be a starting point for anyone to find and download spatial data related to different domains, and visualize different types of spatial data objects using different approaches.
So if you think of anymore R packages that would fit into this collection, ideas on new tutorials or cool spatial visualizations, do reach out to us! Let’s talk about how we can collaborate!
Filed under
Suggest an edit
Open a pull request
