Thursday, March 30, 2023 From rOpenSci (https://ropensci.org/blog/2023/03/30/r-universe-stars-3-en/). Except where otherwise noted, content on this site is licensed under the CC-BY license.
A new post of our interview series “Meeting the stars of the R-universe”. We aim to introduce the teams and people behind the development of software and packages many of us use and which are available through the R-Universe. We want to highlight and explore different teams and projects around the world, the work they do, their processes and users. Our third stop is Norway to talk with Athanasia Monika Mowinckel. Be sure to watch the video at the end with excerpts from the interview.
Working with the human brain requires specific software and complex developments. However R appears to be the natural way to collect and analyze the huge amount of data needed, and the R-Universe the most friendly place to share and invite collaborations.

Researcher and RSE
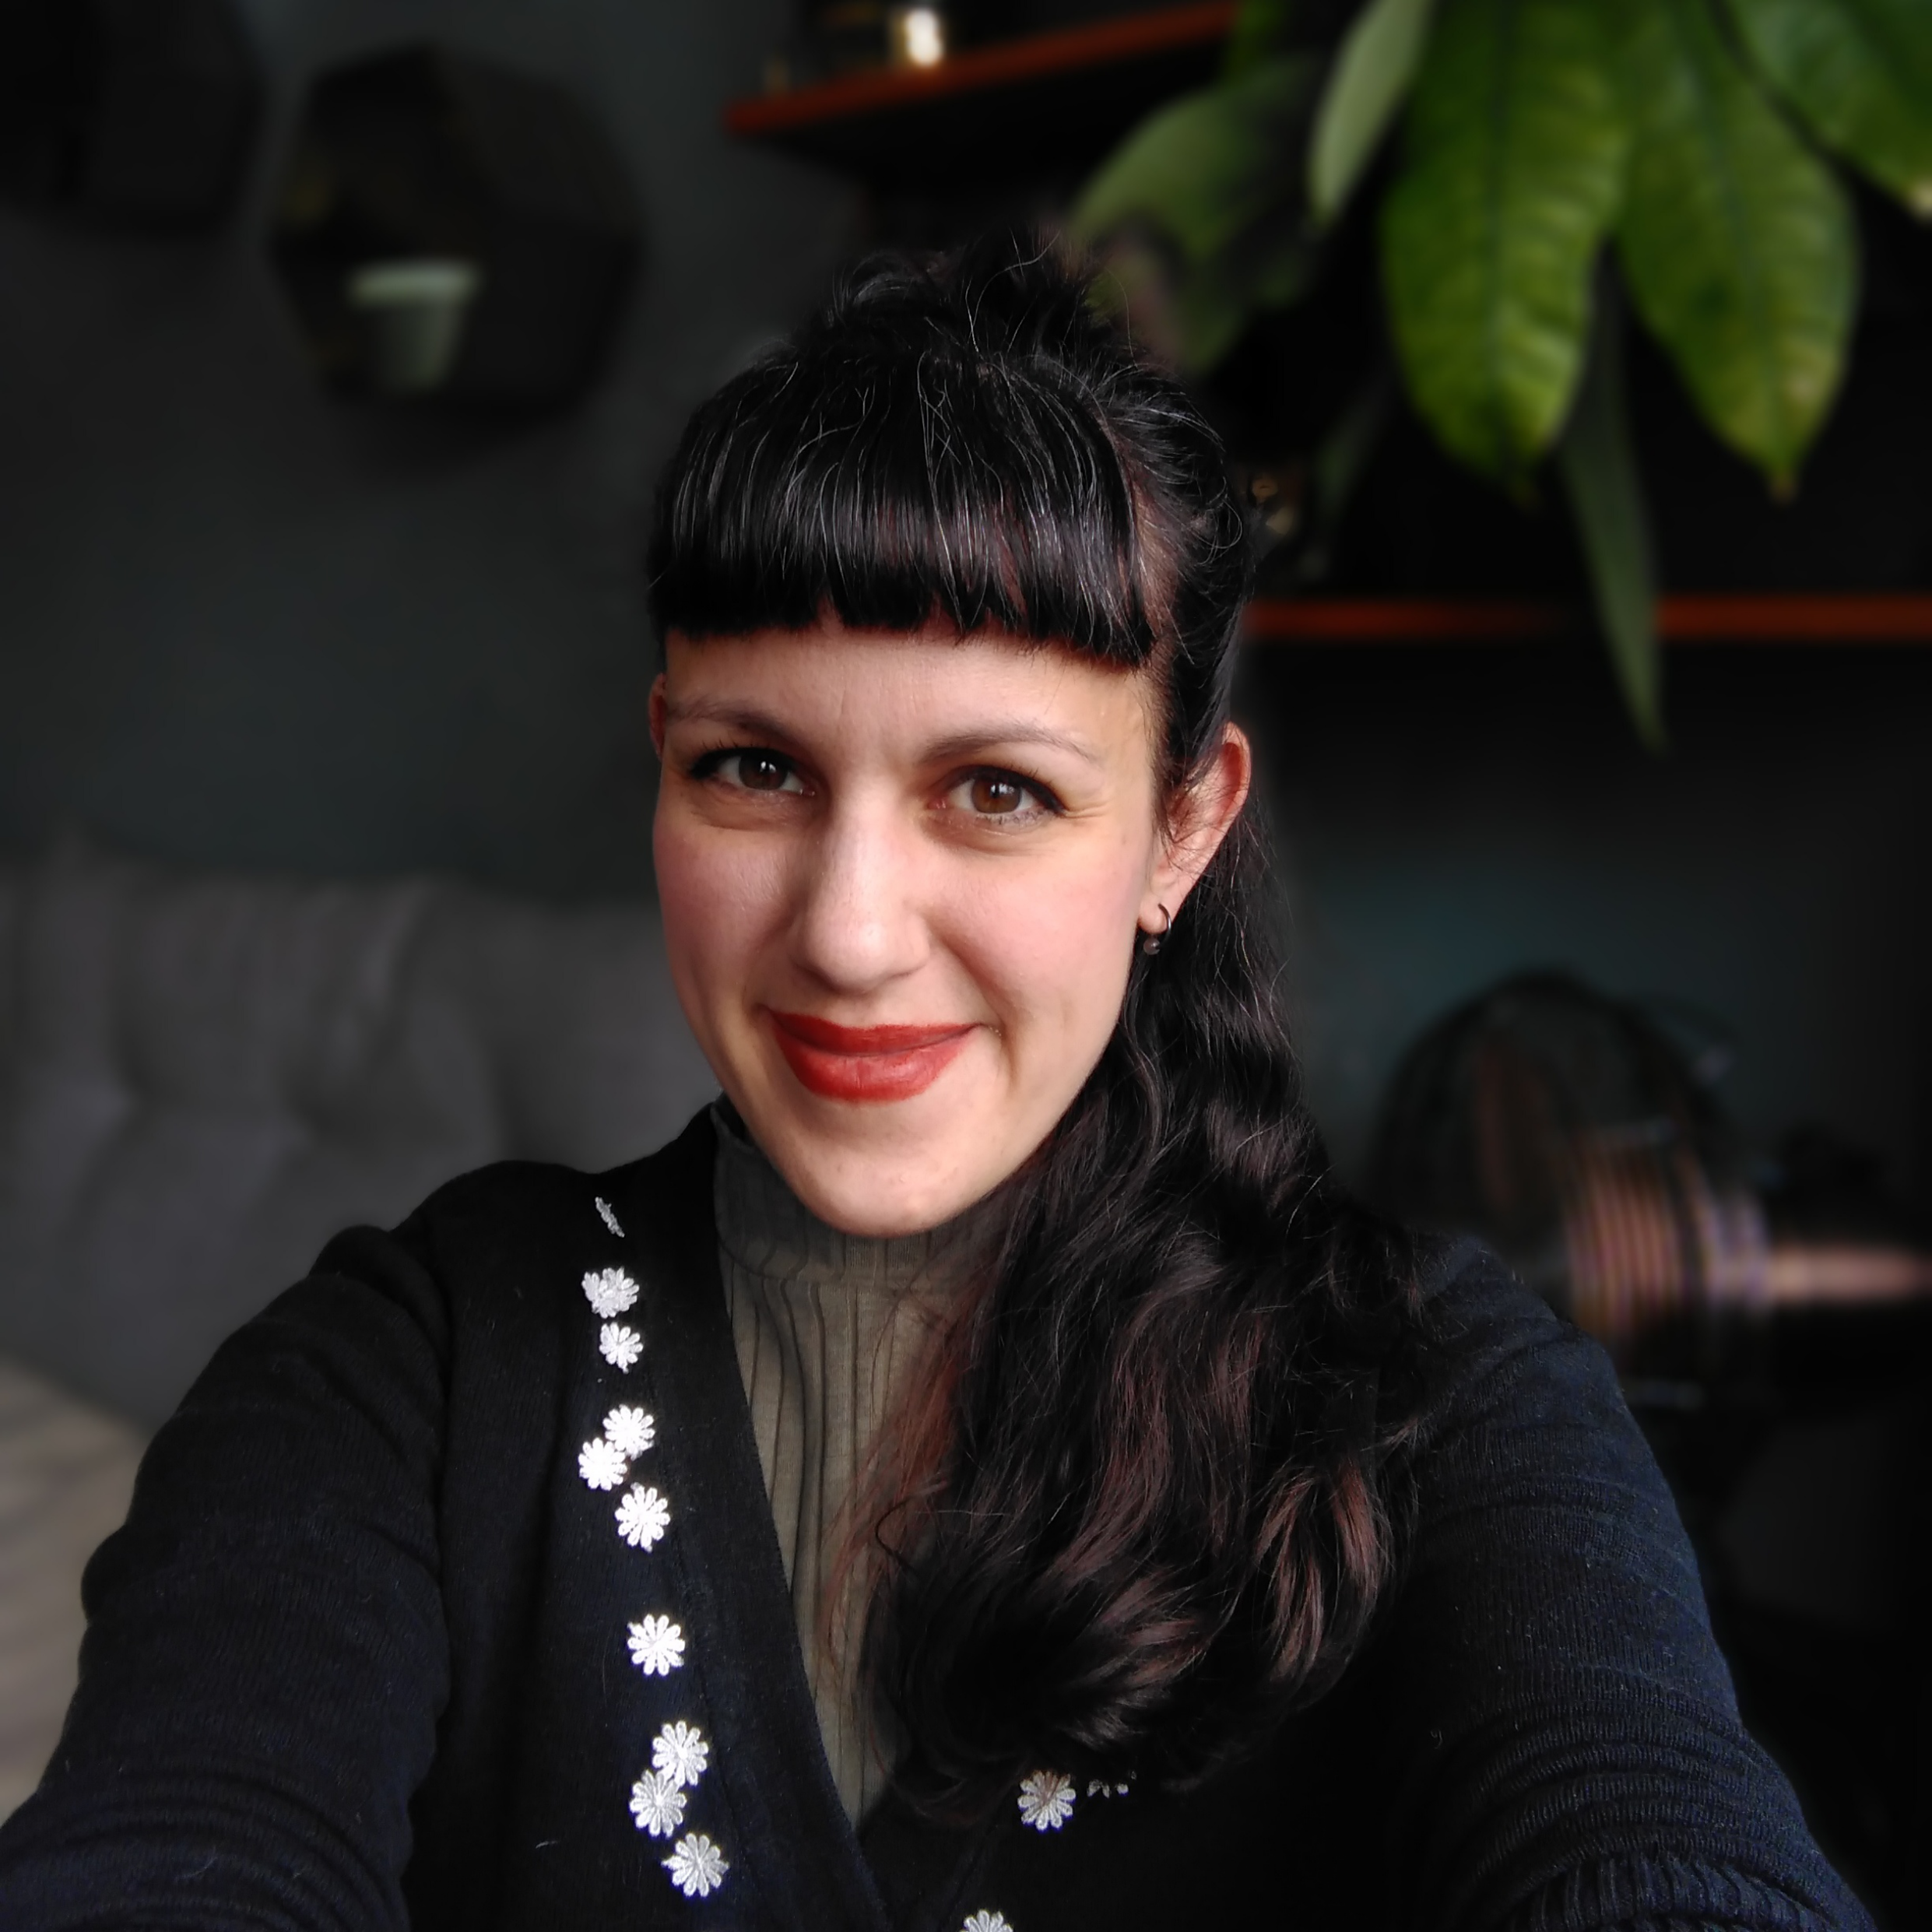
Athanasia Monika Mowinckel introduces herself simply as Mo, which is her nickname. But her CV is much more extensive and includes, among many other activities, her current work at the Center for Lifespan Changes in Brain and Cognition at the University of Oslo in Norway. She works there as a scientist and tells us that her work “involves research software engineering or research data management” and because of that “R is the default statistical program we use for our daily work at the center, and we generate results in the form of R packages.”
Research at the center involves specialized software because of the information they need to process, such as brain images. Athanasia explains that at the end of the day all their statistics are in R, and because of that, “having our R packages in our tool belt when we are working is super important for our staff.”
Athanasia is working on a project called LifeBrain, funded by the European Union, involving 13 European centers. Mo explains that they have developed a lot of research, written publications, and many results have been implemented in R packages. Asked about the project, with passion and great enthusiasm, Mo says:
We are trying to investigate how people are aging, what their brain aging is like, what their cognitive aging is like.
🔗 R-Universe
The R universe actually came at an extremely timely point for us,
Athanasia explains that this platform offered them a simple way to show all the software they were working on. In this research development, there are different types and sources of funding. Even though they have a collective organization in GitHub, they needed a clear way to show all the work that is distributed in different repositories in the personal accounts of the researchers or the accounts of the research centers. That is why Mo assures that in R-Universe “we can create a place for all our universes and thus show the packages.”
In addition, Athanasia explains that an important part of using the R-Universe is that it is very clear who the developers or maintainers are, which means that everyone keeps their corresponding credits and contributions.
Another interesting use of the R-Universe for sharing work that Mo showed us, is the possibility of accessing the data as well as some extra functions used in an analysis. For example, in the Lifebrain Global Brain Health Survey they obtained more than 27 thousand responses, produced articles and papers, and provide all the data and code in the gbhs package (you can see more information about this work in the video below).

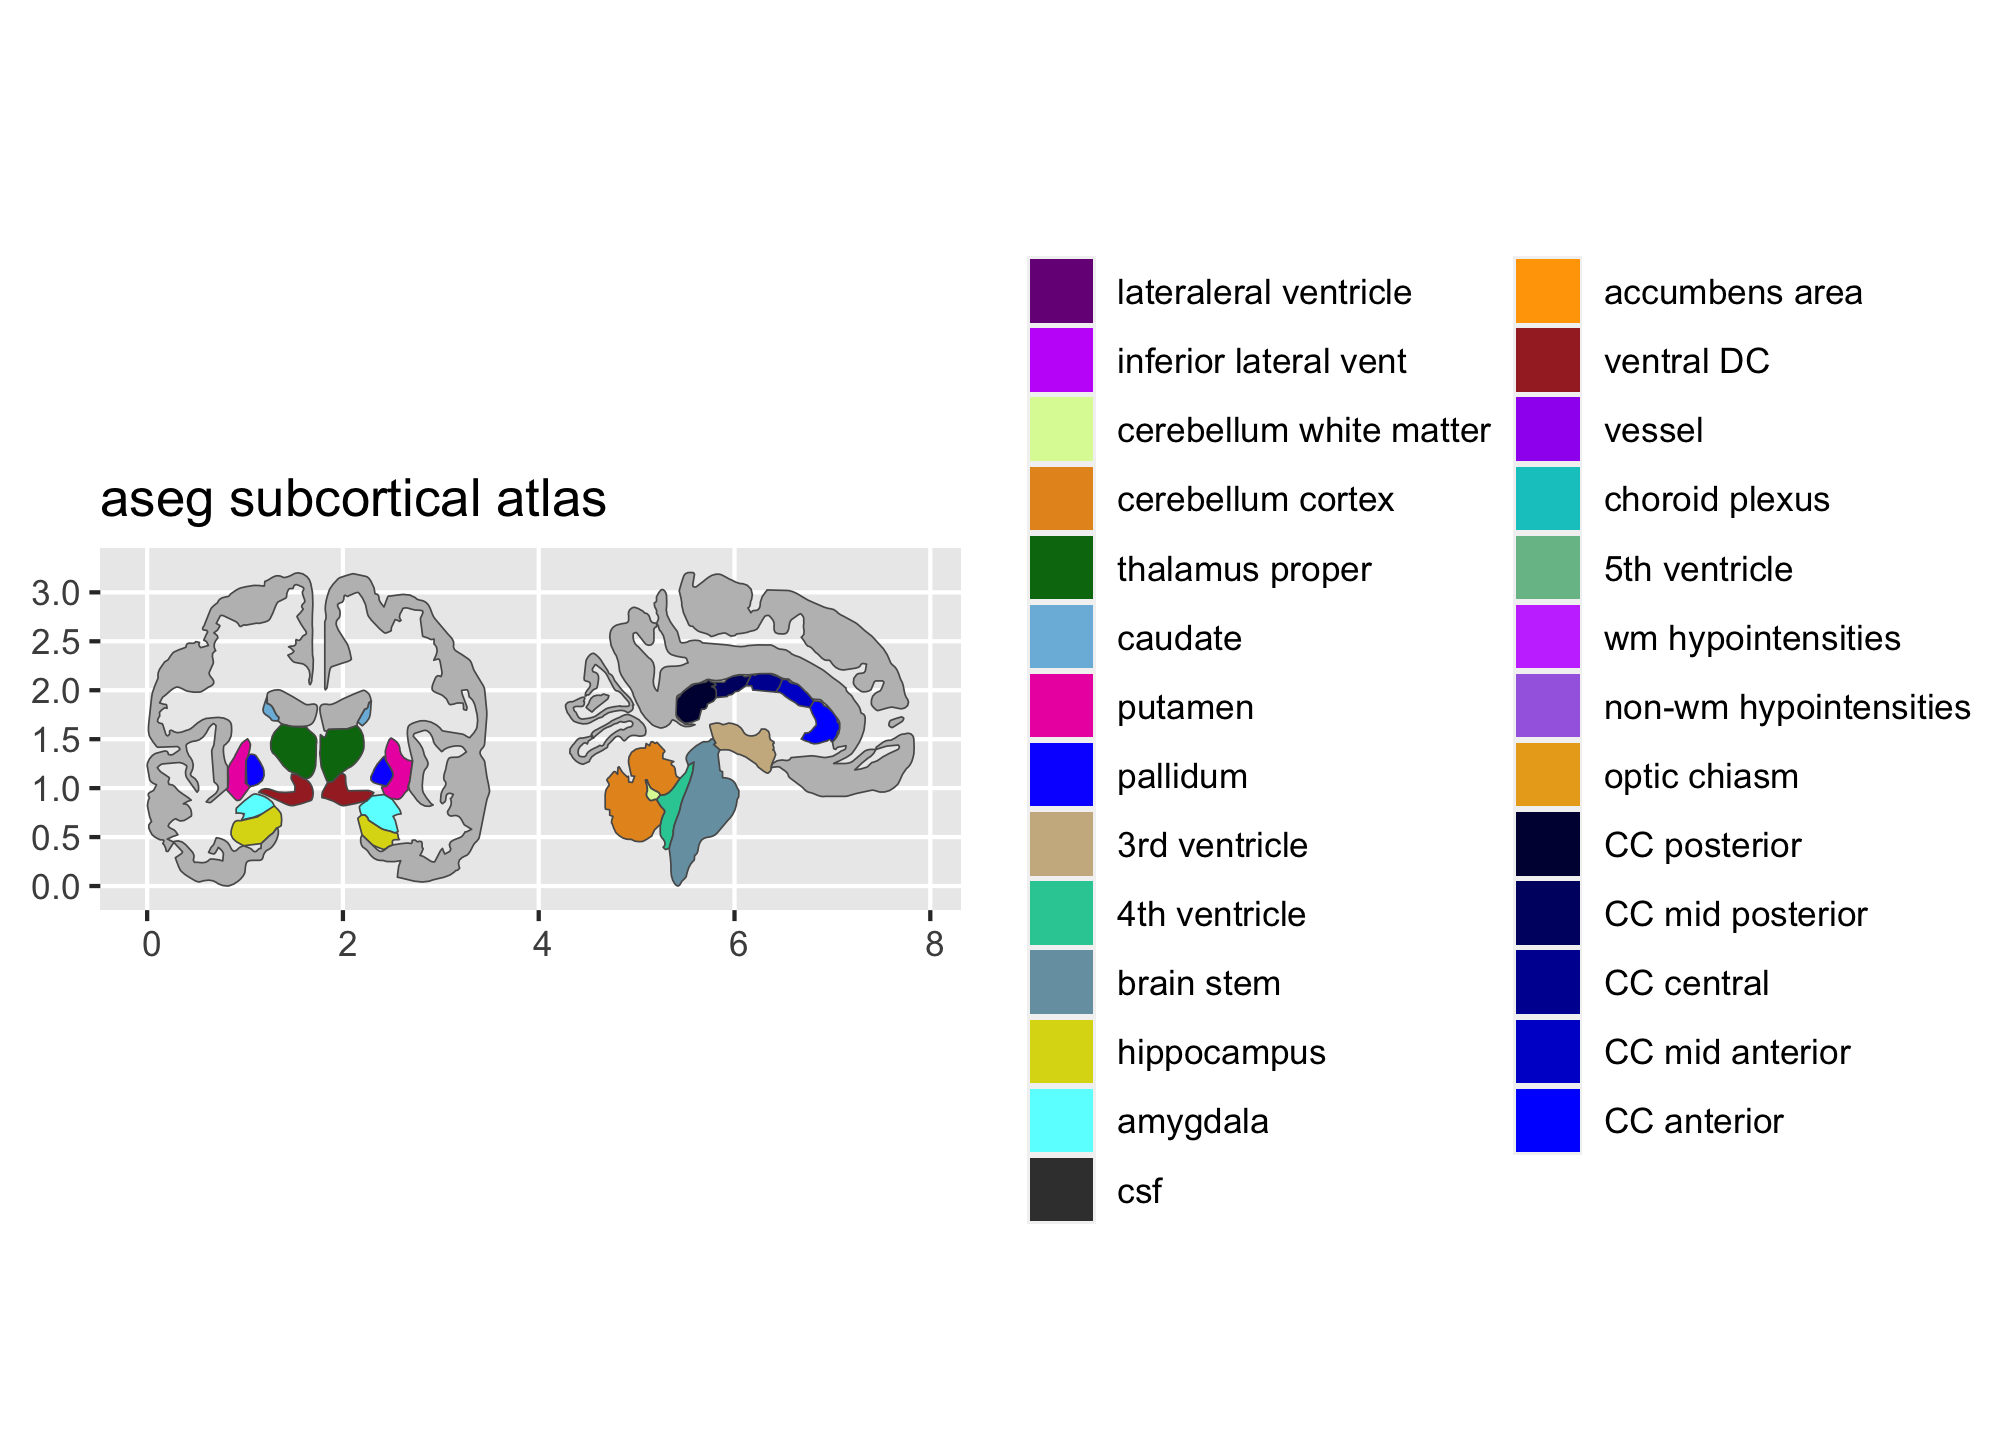
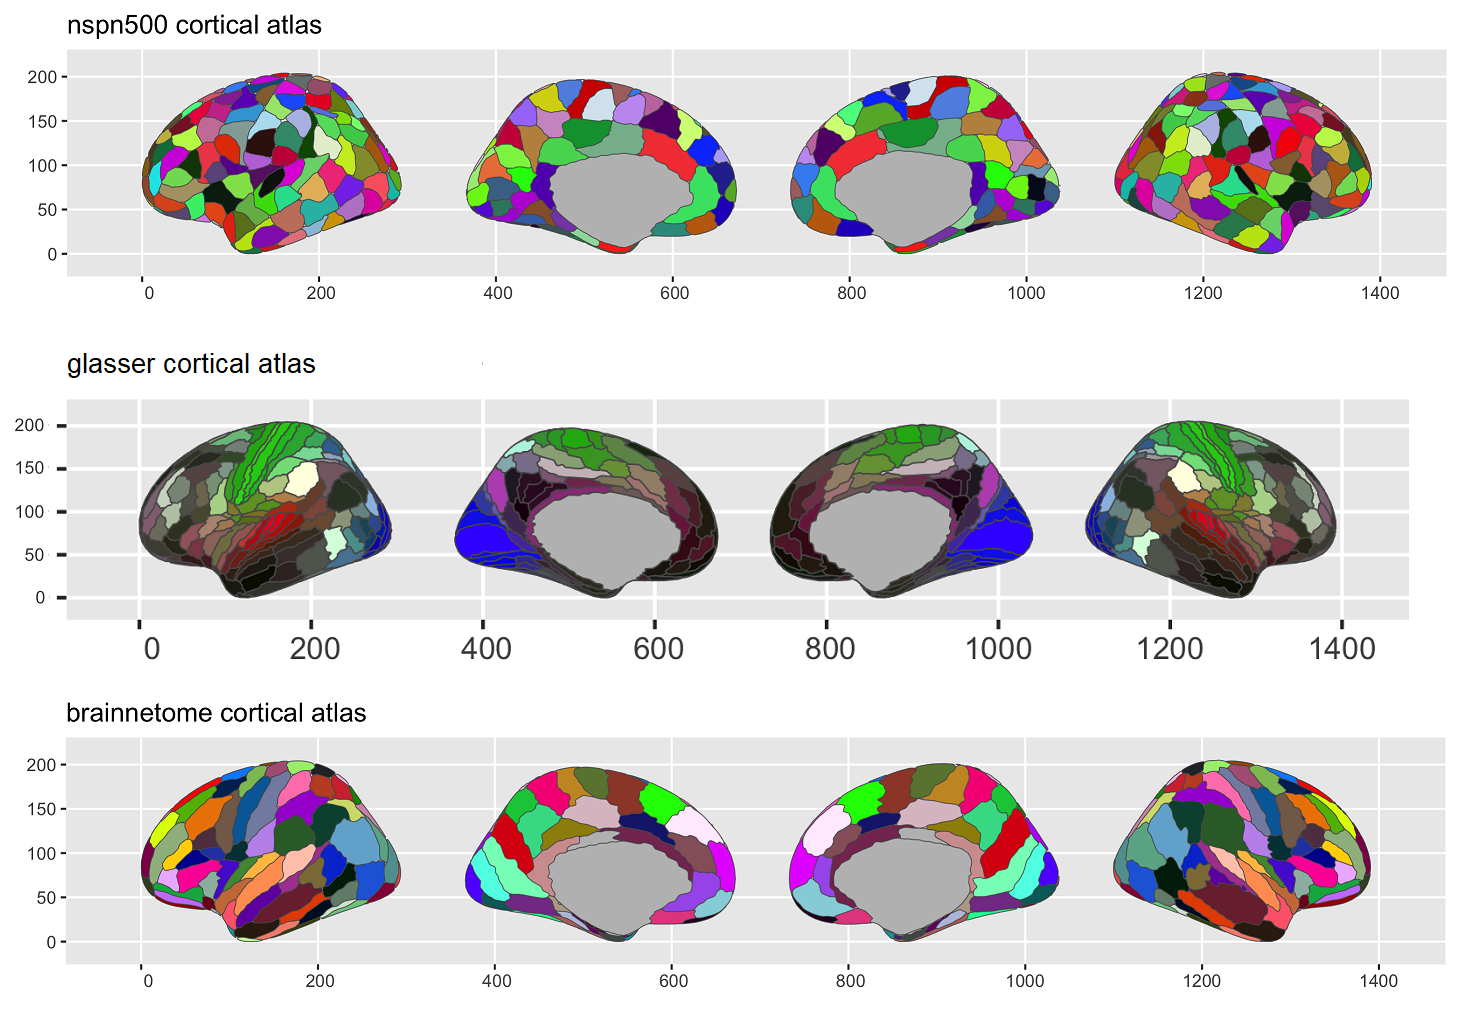
As we explore the packages in the Lifebrain R-Universe, Athanasia shows us her greatest pride: ggseg, software to create images of the brain that have been analyzed with different functions. It was precisely with this work that Mo found in R-Universe the solution to a series of problems with the size of the data and the installation of the tools needed to work:
When the data packages are too big and cannot be reduced, it is not possible to publish them in CRAN (…) and failures appear when users want to install them in their development version that took us a long time to solve and with non-optimal results.
In this context is when R-Universe presents her with a definitive solution:
This is the real solution, to be able to have everything we work on the project with a working installation and not waste any more time troubleshooting our users.

In Athanasia’s experience, R-Universe allowed them to publish all the packages in one place, with easy accessibility and the possibility to receive contributions, maintenance and no installation problems for the users. In her own words:
R-Universe is magic for me.
Remember that the R-Universe generates binaries for different operating systems for all packages that belong to the universe, with no limit on the package size. One of the platform’s objectives is to make it easier to publish and install R packages.
In the following video, Athanasia explains in more detail the development of their Life Brain project, how they use R to organize and work with information, and how the R-Universe allowed them to organize and share all their packages.

