Tuesday, December 19, 2023 From rOpenSci (https://ropensci.org/blog/2023/12/19/champions-program-2023-experience/). Except where otherwise noted, content on this site is licensed under the CC-BY license.
Being a part of the rOpenSci Champion’s program has been a transformative experience, pushing me to explore the world of R package development and contribute to the world of open science. While my initial project proposal took a different route, the unexpected journey led me to create a valuable tool that I am proud to call my own – an R package ChartkickR. In this blog post, I’ll take you through my adventure as a rOpenSci champion and how ChartkickR became the unexpected gem of my experience.
When I embarked on my rOpenSci Champion journey, my original project proposal aimed to ease the use of geospatial data for Microplanning in public health. Little did I know that the path ahead would be filled with twists and turns, ultimately leading me to ChartkickR. As the saying goes, sometimes the best discoveries happen when you least expect them.
As I went through several training sessions and mentoring meetings, I stumbled upon an opportunity to create something truly unique – a htmlwidget1 that would simplify the process of creating interactive and visually appealing charts in R. This idea took root and blossomed into what is now ChartkickR.
ChartkickR, at its core, is an htmlwidget that seamlessly integrates with the Chartkick JavaScript library. It provides R users with a straightforward interface to generate beautiful and interactive charts using R code. From line charts to pie charts, ChartkickR empowers users to visualize their data effortlessly using a single line of code.
🔗 Examples of ChartkickR code
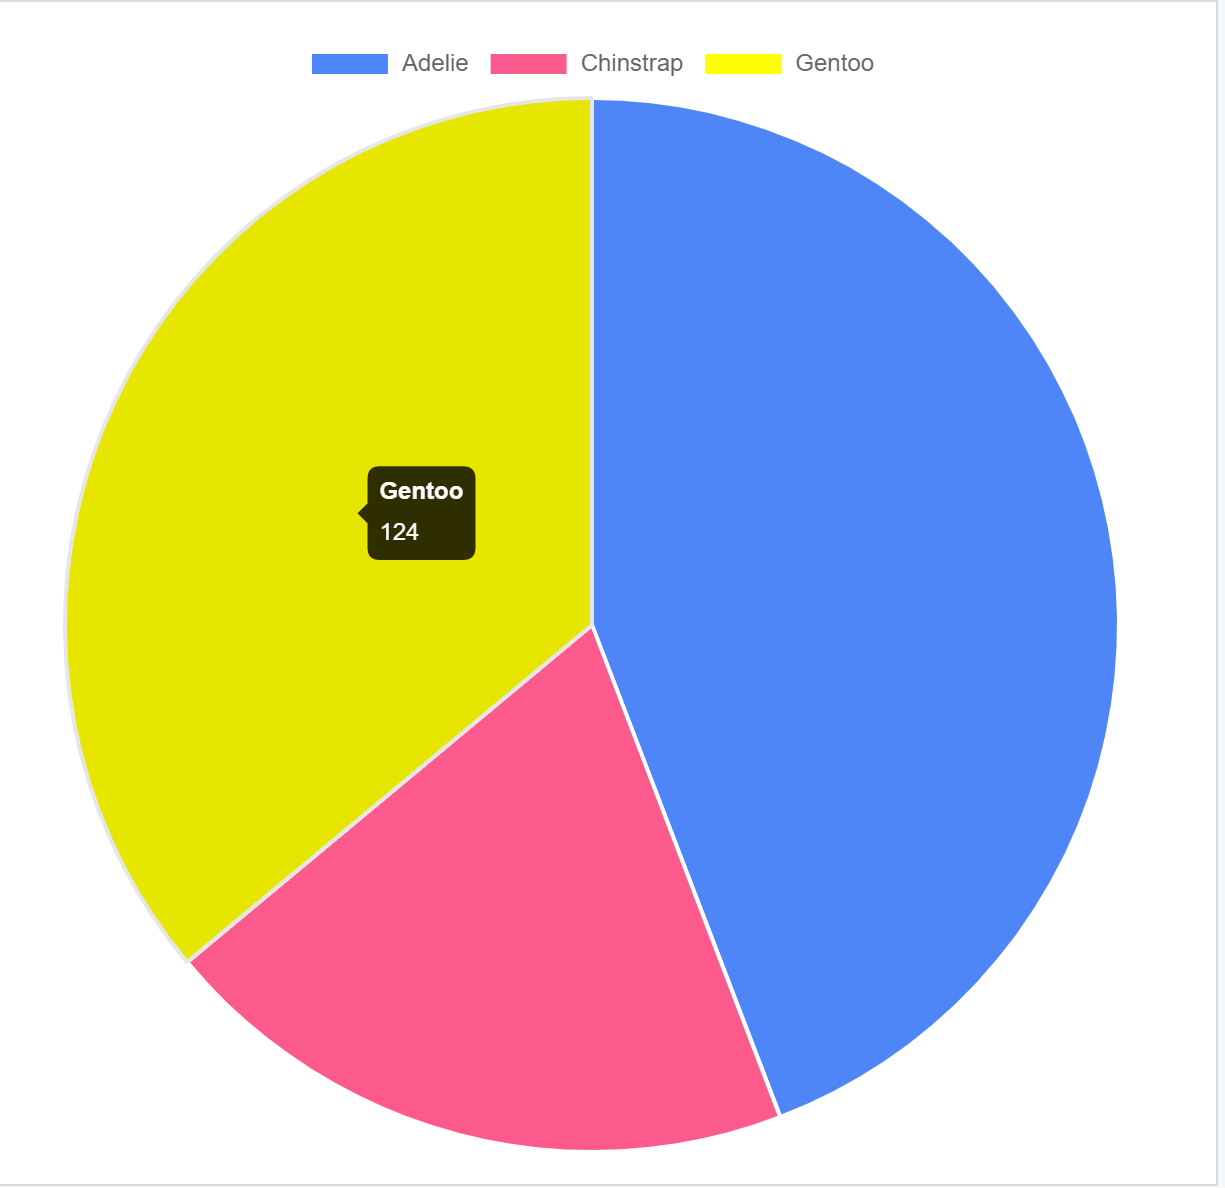
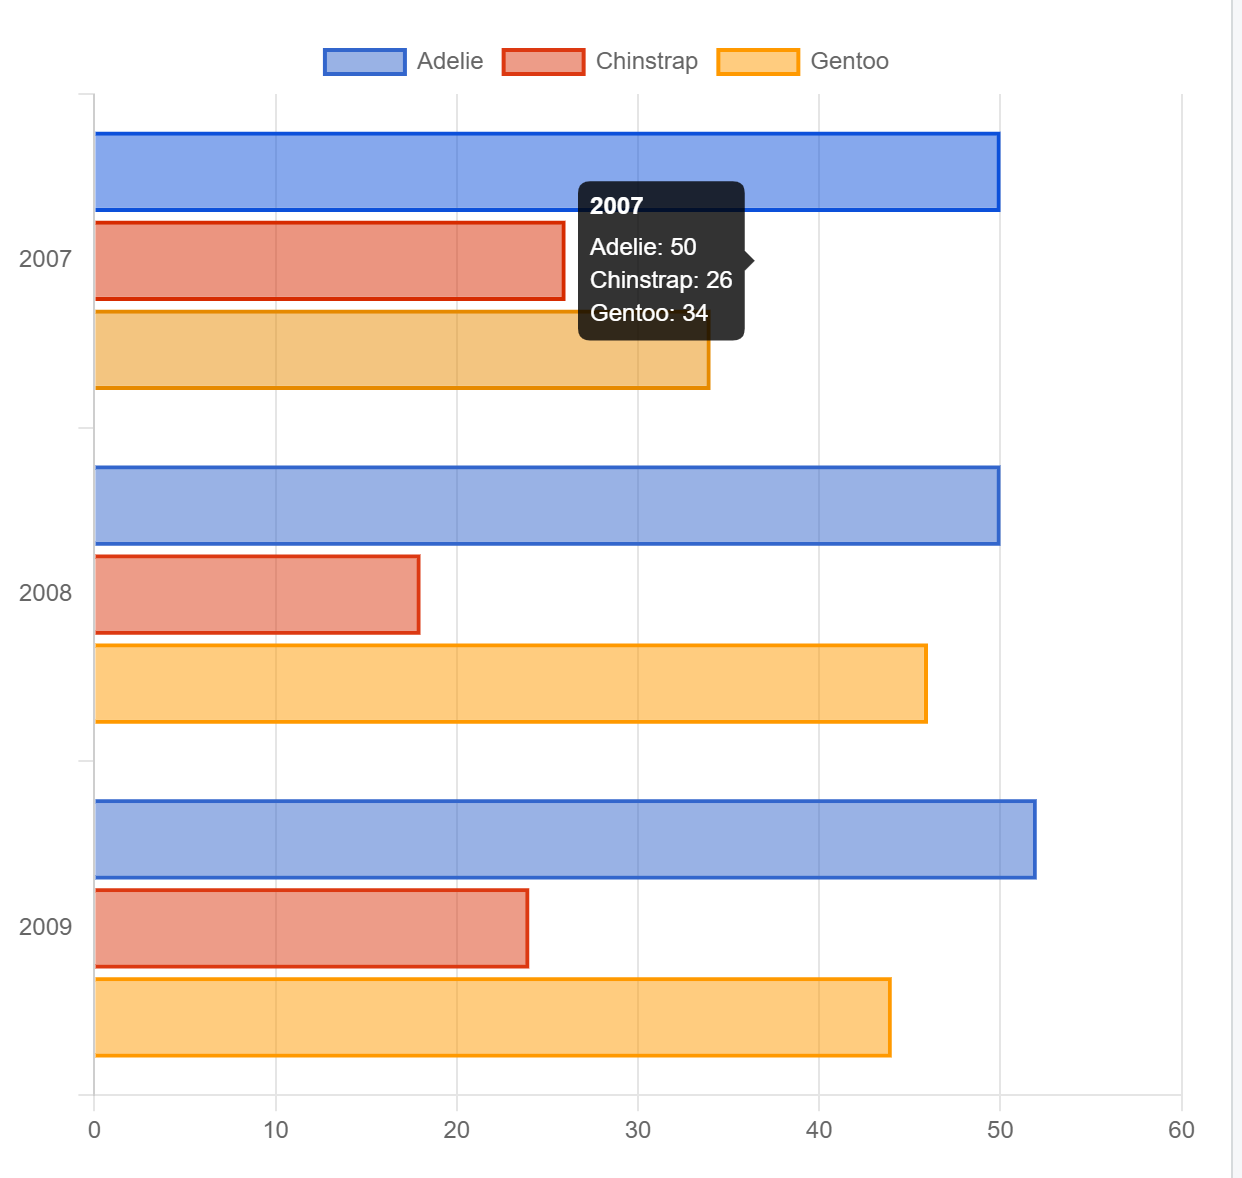
The package has ten types of plots, and all are very simple to build; here are three classic examples using the Palmer Penguins package as data.
🔗 Scatter plot
library(palmerpenguins)
library(ChartkickR)

p_data <- select(penguins, bill_length_mm, bill_depth_mm)
chartkickR(data = p_data,
                  x = bill_length_mm, y = bill_depth_mm,
                  type = "ScatterChart")

🔗 Pie chart
p_data <- penguins |>
    count(species) |>
    set_names(c("species", "count"))

chartkickR(data = p_data,
                  x = species, y = count,
                  type = "PieChart",
                  colors = list("#4f86f7", "#fc5a8d", "yellow"))

🔗 Multiple Series Bar
p_data <- penguins |>
  group_by(year) |>
  count(species)

chartkickR(data = p_data,
                  x = year, y = n,
                  type = "BarChart",
                  group = species, curve = TRUE)

🔗 Developing a new package as rOpenSci Champion
Developing ChartkickR was not without its challenges. I encountered hurdles in the coding process, faced moments of doubt, and navigated through the complexities of integrating R with JavaScript. However, each challenge, like having to learn JavaScript to understand the library and create the package in R, was met with perseverance, and every triumph brought a sense of accomplishment that fuelled my passion for the project. I would like to appreciate the support of John Coene and the guidance from my mentor, Christina Maimone.
One of the most rewarding aspects of the rOpenSci champion program was the collaboration with a diverse and supportive community led by Yanina Bellini Saibene. Through discussions, feedback, and shared insights, ChartkickR evolved into a tool that not only met my initial vision but also exceeded it with the input of fellow rOpenSci champions and mentors.
The rOpenSci Champions Program extends beyond coding; it’s a holistic experience that fosters personal and professional growth. From honing technical skills to friendliness within the open-source community, the program equipped me with invaluable tools that will undoubtedly shape my future endeavours.
In this end, I have already organized two events with my local R User Groups - Abuja RUG and R-Ladies Abuja Chapter - showcasing what I learned about building htmlwidget in R. Looking into the future, I will continue to improve on my project and share it with the rOpenSci community.
My journey as a rOpenSci Champion has been a rollercoaster of discovery, and ChartkickR stands as a reward. I am grateful for this opportunity given to me by rOpenSci, the support of the rOpenSci community, the guidance of my mentor, and the opportunities for growth that this program has provided. As I look back on this experience, I am not only proud of the htmlwidget I created but also of the person I’ve become throughout this incredible journey.
By definition, an R ‘htmlwidget’ is a framework for creating HTML widgets that render in various contexts including the R console, ‘R Markdown’ documents, and ‘Shiny’ web applications. ↩︎

