
Tuesday, August 26, 2025 From rOpenSci (https://ropensci.org/blog/2025/08/26/csidnet-agm-2025/). Except where otherwise noted, content on this site is licensed under the CC-BY license.
The “Climate Sensitive Infectious Disease” (CSID) Network looks to connect a global community of actors contributing towards impactful CSID software tools and establish localized CSID communities that can link existing on-the-ground issues and initiatives to the development and maintenance of CSID tools.
On July 21, during the 2025 Annual General Meeting of the CSIDNet, Yanina Bellini Saibene and Samuel Schildhauer co-lead a session titled “Open Science, R Packages, and Research Software Development”. The session was designed not only to introduce participants to tools and practices in open science with R but also to encourage active reflection and discussion on their own workflows and the challenges they face.
🔗 Kicking Things Off: The Human Barometer
To break the ice and get people moving and thinking we use a documented method from an rOpenSci unconf, called the Human Barometer. Participants physically positioned themselves along a line in response to a series of light-hearted and thought-provoking prompts, such as:
- Cats or Dogs?
- I practice open science in my activity.
- I use R in my research.
Participants then discussed their positions and tried to convince the other group to change their minds. This dynamic approach not only brought energy into the room but also offered a quick glimpse into the community’s practices and perspectives, giving the participants the chance to become acquainted interactively.
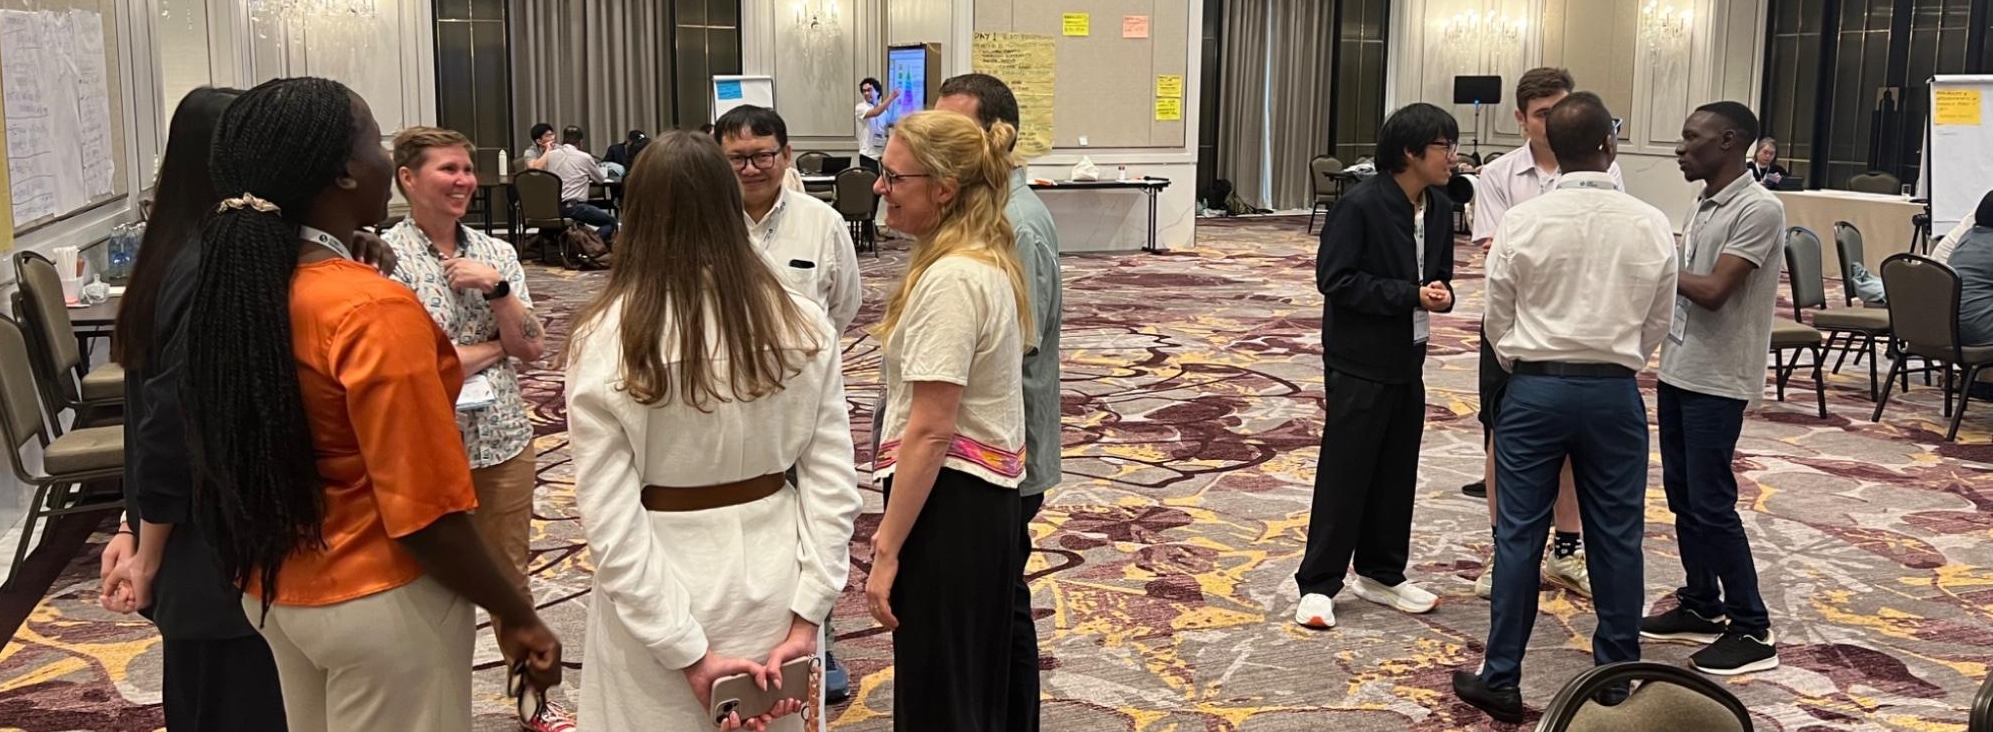
Participants sharing why they are in that group when asked, ‘I use R in my research’. Photo by Yanina Bellini Saibene.
🔗 Mapping Our Tools: Data Science Workflows in Practice
The first structured discussion focused on the tools participants use in their data science workflows. Using the well-known R for Data Science (R4DS) framework, participants were invited to place post-it notes under each step of the process-import, tidy, transform, visualize, model, and communicate—indicating which tools or packages they rely on.
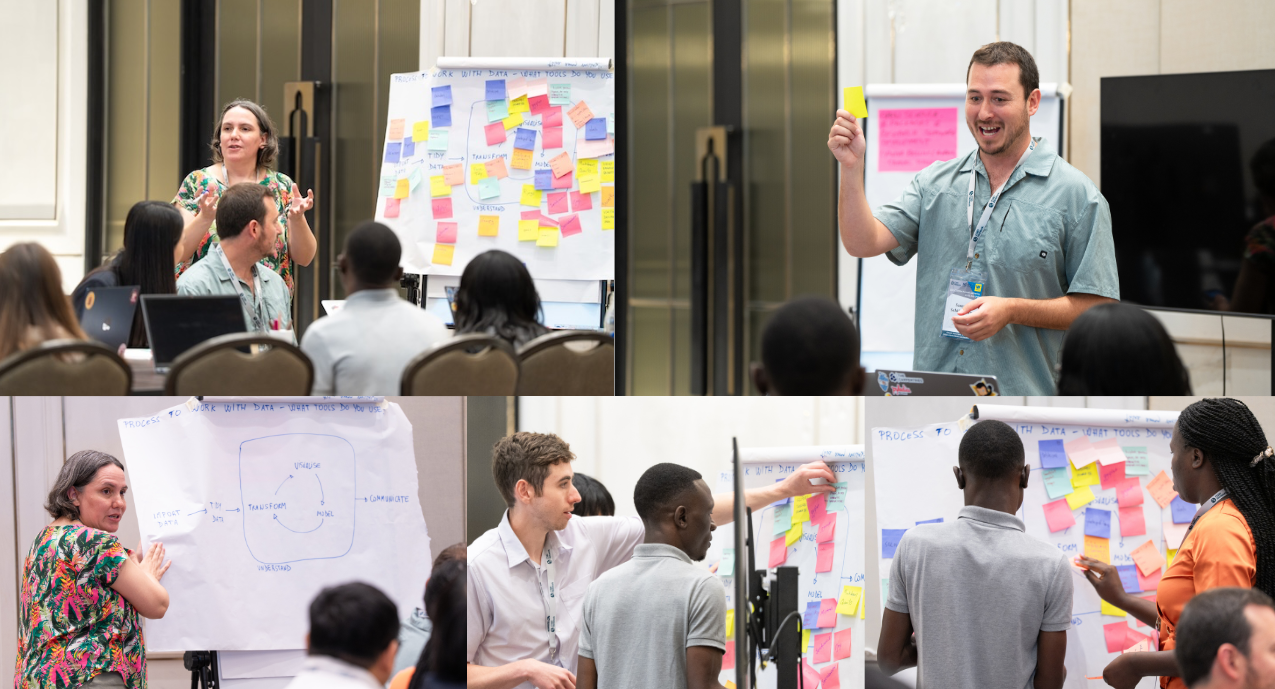
Yanina and Sam guiding the conversation about the tools used by participants in their data science workflows and of the participants talking and putting sticky color notes in the diagram. Photos by: Natthaphon Sakulvanaporn (BangkokVDO)
This exercise sparked rich conversations about the diversity of tools people use, the areas with strong support (like data visualization), and the steps where participants often struggle to find the right tools. It was also noted that tools such as Arrow, which allow large amounts of data to be handled in R, and targets, which allow work with pipelines, were not mentioned among the tools. The exercise opened the door to discussing gaps in tooling—opportunities for future development or collaboration, like easier mapping tools and shared code chunks between different notebooks in R.
The table summarizes the tools that the attendees shared for each of the steps in the process.
🔗 Uncovering Barriers: A Chalk Talk on Obstacles
The second discussion turned the focus toward obstacles participants face when trying to engage in open science and research software development. In a Chalk Talk format, participants wrote down their thoughts under three color-coded categories:
- Expertise obstacles (e.g., lack of training, steep learning curves)
- Language obstacles (e.g., lack of documentation in local languages)
- Infrastructure obstacles (e.g., limited access to hardware or internet)
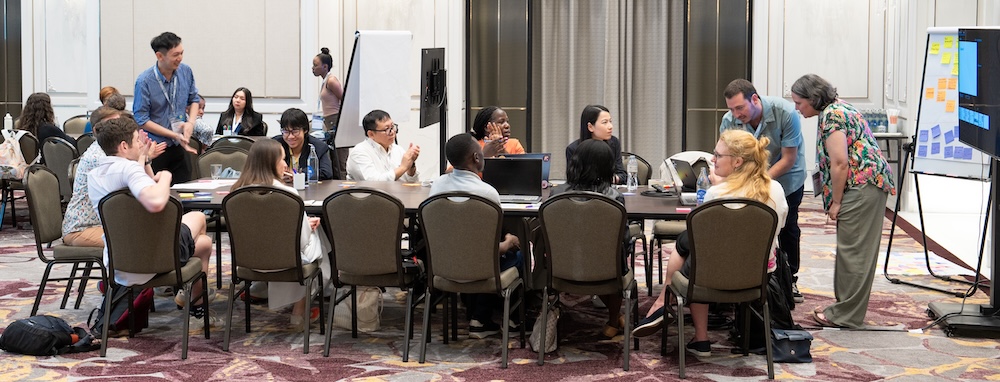
Session attendees and host during the Chalk Talk discussion. Photos by: Natthaphon Sakulvanaporn (BangkokVDO)
This open and honest exchange revealed a wide range of barriers. It also underscored the importance of initiatives that address equity and access in research infrastructure.
Expertise Obstacles: Expertise Knowledge, Bad/No update documentation, Not knowing what’s out there (avoid reinvent the wheel), Packages not longer supported, Which packages/function to use, Lack of a learning roadmap, Trouble shooting for less used packages, translations between differents fields
Language Obstacles: Human language (material availability), Multilingual documentation, Training and docs in native languages, Documentation too complex, Not clear examples of use, Need of prior understanding
Infrastructure Obstacles: Equipment, Processing resources, storage capacity, remote HPC access, hosting for app, funding software development
🔗 Sharing Solutions: Use-Case Presentations
To ground the discussion in real-world examples, Sam and Yani each presented a use-case:
🔗 Serodynamics: Collaborative R-package Development
Sam is part of the SeroEpidemiology Research Group (SERG) at UC Davis, led by Dr. Kristen Aiemjoy and Dr. Ezra Morrison. Sam gave a presentation highlighting his team’s development of an R package called Serodynamics.
The package deploys an innovative technique that uses data from longitudinal serologic cohorts to model antibody kinetic seroresponses for a given infection. This information can then be applied to cross-sectional serosurveys to estimate disease incidence and time since infection using another package the team developed called Serocalculator. The package uses a Bayesian (Runjags) framework to estimate the initial antibody concentration (y0), peak concentration (y1), time to peak (t1), decay rate (α), and decay shape (r). The SERG team hopes to have serodynamics ready for use in the coming year.
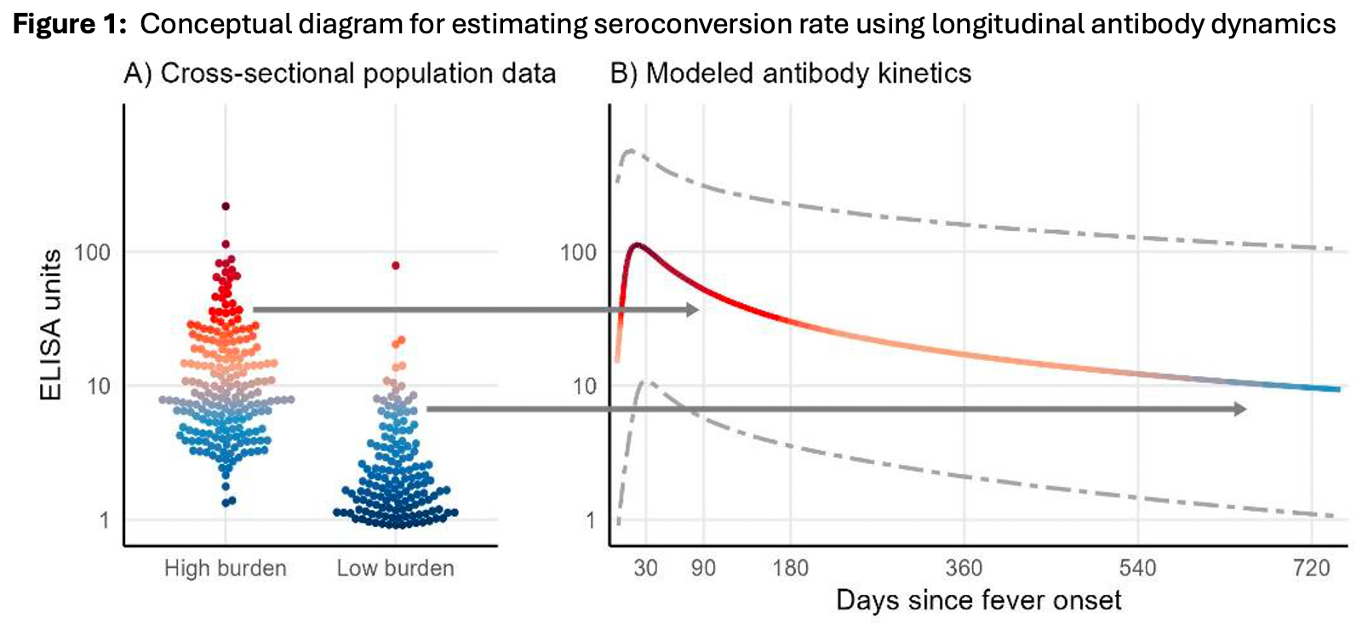
Conceptual diagram for estimating seroconversion rate using longitudinal antibody dynamics
🔗 rOpenSci: Supporting Open and Sustainable Research Software
Yani introduced the rOpenSci ecosystem, highlighting how it supports the development, peer review, and sustainability of research software in R. She emphasized the community-driven approach and the importance of good practices in software development for science.
Our Software Peer Review is a transparent, open, non-adversarial R package review with the goal of improve the software we build to made science.
R-universe is rOpenSci’s platform for improving publication and discovery of research software in R. R-universe build the binaries for different OS including webassembly! It also builds the documentation, distributes datasets and keeps track of lots of stats about your package.
Our Multilingual Publishing project focus on create the process and infrastructure to provide our content in other languages than English while ensuring the quality of that content. It also looks to provide to the R community with multilingual capabilities in different contexts.
Our Champions Program seeks to Identify, recognize and reward leaders in a community. It is focussed on people from historically and systematically excluded groups who are interested in contributing to rOpenSci and the broader open source and open science communities. Through mentoring and training, champions develop a project during a year.
Yani mentioned how each of the rOpenSci projects can serve as tools to overcome some of the barriers mentioned in the discussions, such as peer review and the community of developers who not only maintain but also generate documentation, use cases, and answer questions, with research-oriented packages, even if they are niche. Also the Champions Program as a learning path for scientists that develop research software.
She also shared the existence of pyOpenSci for people who program in Python and The Carpentries1 for introductory workshops and open lessons.
🔗 Final thoughts
This session provided a mix of interaction, reflection, and learning. It helped participants connect their personal experiences to broader open science practices, surfaced common challenges, and introduced them to new tools and communities. By the end of the 90 minutes, it was clear that the path to more open, accessible, and sustainable research software is one best walked together. If you are interested in learning more about upcoming CSIDNet events and resources, you can sign up for the main list.
Yani is the chair of The Carpentries Board of Directors and a certified Instructor and Trainer. ↩︎
Filed under
Suggest an edit
Open a pull request
