All posts (Page 120 of 130)
The rOpenSci project is a poster child for the fluid collaboration that has become increasingly common these days thanks to platforms like Twitter and GitHub. It has been really inspring to see open discussions take shape as rough ideas, which rapidly turn into prototype research software, all of which are now happening in the order of few days to weeks rather than months to years. The origins of this project itself lead back to a series of serendipitous conversations that occurred over Twitter three years ago. Today we are a rapidly growing community of scientists, students, software developers, and information researchers....
One of the goals of the rOpenSci is to facilitate interoperability between different data sources around web with our tools. We can achieve this by providing functionality within our packages that converts data coming down via web APIs in one format (often a provider specific schema) into a standard format. The new version of rWBclimate that we just posted to CRAN does just that. In an earlier post I wrote about how users could combine data from both rgbif and rWBclimate. Back then I just thought it was pretty cool that you could overlay the points on a nice climate map. Now we’ve come a long way, with the development of an easier to use and more comprehensive package for accessing species occurrence data, spocc, and added conversion functions to create spatial objects out of both climate data maps, and species occurrence data. The result is that you can grab data from both sources, and then extract climate information about your species occurrence data....
Editor’s note: This is a guest post by Matt Sundquist from Plot.ly.
Ggplotly and Plotly’s R API let you make ggplot2 plots, add py$ggplotly(), and make your plots interactive, online, and drawn with D3. Let’s make some.
🔗- Getting Started and Examples
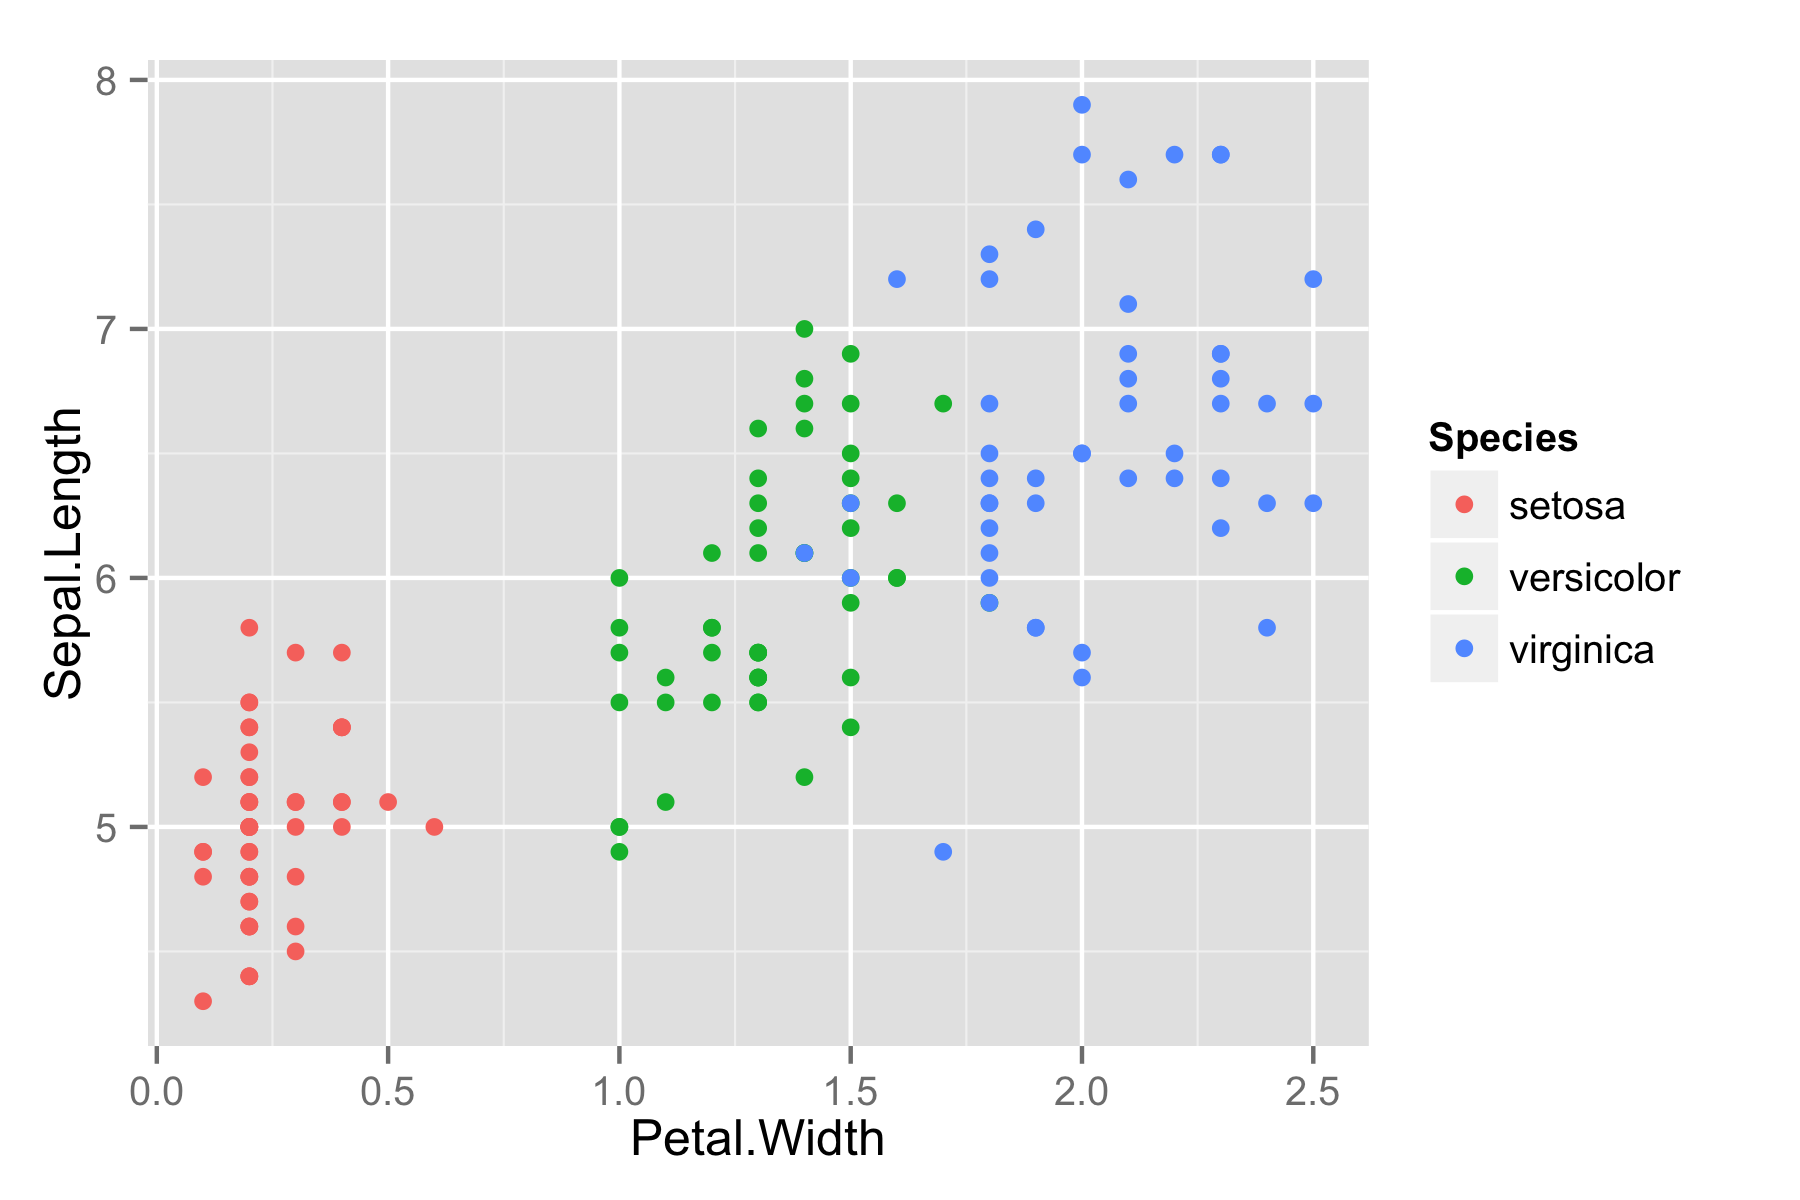
Here is Fisher’s iris data.
library("ggplot2")
ggiris <- qplot(Petal.Width, Sepal.Length, data = iris, color = Species)
print(ggiris)
Let’s make it in Plotly. Install:
install.packages("devtools")
library("devtools")
install_github("plotly", "ropensci")
Load.
library("plotly")
## Loading required package: RCurl
## Loading required package: bitops
## Loading required package: RJSONIO
Sign up online, use our public keys below, or sign up like this:
...Editor’s note: This is the first in a series of posts from rOpenSci’s recent hackathon.
I recently had the pleasure of participating in rOpenSci’s hackathon. To be honest, I was quite nervous to work among such notables, but I immediately felt welcome thanks to a warm and personable group. Alyssa Frazee has a great post summarizing the event, so check that out if you haven’t already. Once again, many thanks to rOpenSci for making it possible!
...We’ve received a number of questions from our users about dealing with the finer details of data sources on the web. Whether you’re reading data from local storage such as a csv file, a .Rdata store, or possibly a proprietary file format, you’ve most likely run into some issues in the past. Common problems include passing incorrect paths, files being too big for memory, or requiring several packages to read files in incompatible formats. Reading data from the web entails a whole other set of challenges. Although there are many ways to obtain data from the web, this post primarily deals with retrieving data from Application Programming Interfaces also known as APIs....