All posts (Page 125 of 133)
We recently pushed the first version of rnoaa to CRAN - version 0.1. NOAA has a lot of data, some of which is provided via the National Climatic Data Center, or NCDC. NOAA has provided access to NCDC climate data via a RESTful API - which is great because people like us can create clients for different programming languages to access their data programatically. If you are so inclined to write a bit of R code, this means you can get to NCDC data in the R environment where your workflow is reproducible, and you can connect data acquisition to a suite of tools for data manipulation (e.g., plyr), visualization (e.g., ggplot2), and statistics (e.g., lme4, etc.)....
Reproducible research involves the careful, annotated preservation of data, analysis code, and associated files, such that statistical procedures, output, and published results can be directly and fully replicated. As the push for reproducible research has grown, the R community has responded with an increasingly large set of tools for engaging in reproducible research practices (see, for example, the ReproducibleResearch Task View on CRAN). Most of these tools focus on improving one’s own workflow through closer integration of data analysis and report generation. But reproducible research also requires the persistent - and perhaps indefinite - storage of research files so that they can be used to recreate or modify future analyses and reports....
We just released a new version of taxize - version 0.2.0. This release contains a number of new features, and bug fixes. Here is a run down of some of the changes:
🔗
First, install and load taxize
install.packages("rgbif")
library(taxize)
🔗
New things
🔗
New functions: class2tree
Sometimes you just want to have a visual of the taxonomic relationships among taxa. If you don’t know how to build a molecular phylogeny, don’t have time, or there just isn’t molecular data, you can sorta build one using taxonomy. Building on our classification function, you can get a bunch of taxonomic hierarchies from the classification function, then pass them to the new function class2tree. Like so:
This post was updated on August 20, 2014, with
AntWebversion0.7.2.99. Please install an updated version to make sure the code works.
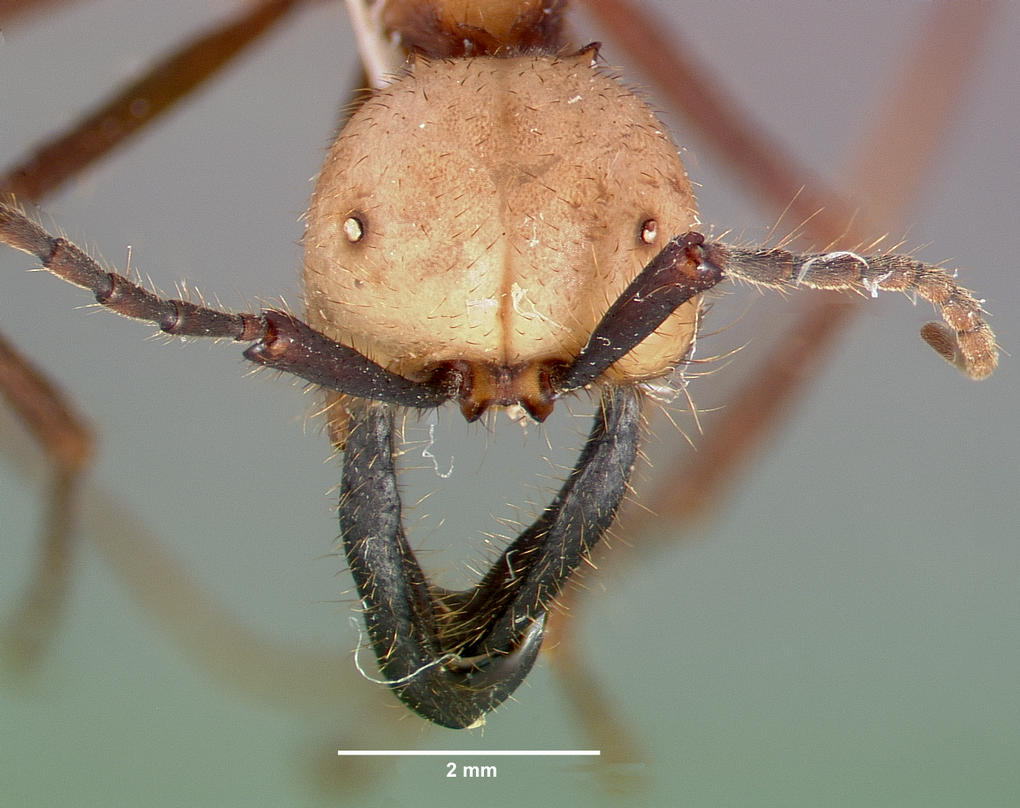
Data on more than 10,000 species of ants recorded worldwide are available through from California Academy of Sciences’ AntWeb, a repository that boasts a wealth of natural history data, digital images, and specimen records on ant species from a large community of museum curators.
rgbif is an R package to search and retrieve data from the Global Biodiverity Information Facilty (GBIF). rgbif wraps R code around the [GBIF API][gbifapi] to allow you to talk to GBIF from R.
We just pushed a new verion of rgbif to cran - v0.5.0. Source and binary files are now available on CRAN.
There are a few new functions: count_facet, elevation, and installations. These are described, with examples, below.