All posts (Page 91 of 128)
 ZgotmplZ
 style=" object-fit: cover; object-position: center; height: 250px; width: 250px; margin-right: 15px"
/>
<p>
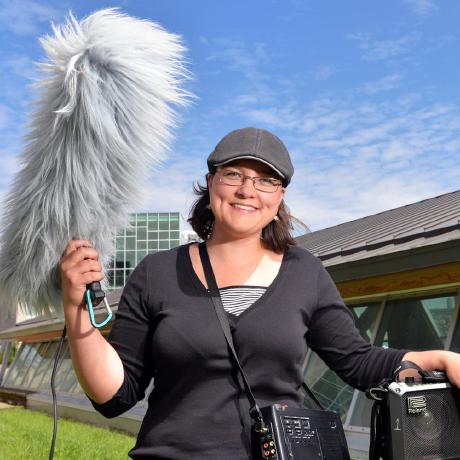
<em>Dr. Julia Stewart Lowndes [@juliesquid on Twitter] is the Science Program Lead for the Ocean Health Index and works at the National Center for Ecological Analysis and Synthesis. She and Sean Kross discussed how data science, open science, and community can help reproducibility in research.</em>
</p>
</figure>
</div>
[This interview occurred at the 2017 rOpenSci unconference]
SK: I’m Sean Kross, I’m the CTO of the Johns Hopkins Data Science Lab. Today I’m interviewing Julia Stewart Lowndes. Julia, what is your current preferred job title?
...For a fifth year running, we are excited to announce the rOpenSci unconference, our annual event loosely modeled on Foo Camp. rOpenSci unconferences have a rich history. You can get a feel for them by reading collected stories about people and projects from unconf17.
We’re organizing unconf18 to bring together scientists, developers, and open data enthusiasts from academia, industry, government, and non-profits to get together for a couple of days to hack on various projects and generally enrich our community. The agenda is mostly decided during the unconference itself. Past projects have related to open data, data visualization, data publication and open science using R. This event is unlike many other unconferences in that it is primarily invite-only, with a few spots set aside for self-nominations from the community at large. That’s you!
...The drake R package is a pipeline toolkit. It manages data science workflows, saves time, and adds more confidence to reproducibility. I hope it will impact the landscapes of reproducible research and high-performance computing, but I originally created it for different reasons. This post is the prequel to drake’s inception. There was struggle, and drake was the answer.
🔗
Dissertation frustration

My dissertation project was intense. The final computational challenge was to analyze multiple genomics datasets using an emerging method and its competitors. Even with GPU computing, which shrank days of runtime down to hours, the full battery of Markov chain Monte Carlo runs took several weeks from start to finish. I organized my workflow as an R package, and I worked in a loop:
...We’re very pleased to be introducing someone who needs no introduction in the R community. Join us in welcoming Maëlle Salmon to rOpenSci as a Research Software Engineer (part time, working from Nancy, France). We’d like to formally introduce her here and share a bit about the kinds of things she’ll be working on.
Maëlle did a B.Sc. in Biology with an emphasis on maths and quantitative work, two Masters degrees - one in Ecology and one in Public Health - and a Ph.D. in epidemiological statistics at the Ludwig-Maximilian University in Germany. Her thesis dealt with statistical algorithms for aberration detection in time series of counts of reported cases of infectious diseases. Most recently, Maëlle worked as a data manager and statistician for the CHAI project. Maëlle has contributed six packages to rOpenSci to date, and has written about two of them, ropenaq and rtimicropem for our guest blog series about onboarded software.
🔗
DBI
What is DBI? DBI is an R package. It defines an interface to relational database management systems (R/DBMS) that other R packages build upon to interact with a specific relational database, such as SQLite or PostgreSQL.
🔗
NoSQL
NoSQL databases are a very broad class of database that can include document databases such as CouchDB and MongoDB, key-value stores such as Redis, and more. They are generally not row-column relational stores though, though can include that. NoSQL is often thought of now as “not only SQL”.
...


