
All posts (Page 93 of 129)
🔗
The problem
Text-mining - the art of answering questions by extracting patterns, data, etc. out of the published literature - is not easy.
It’s made incredibly difficult because of publishers. It is a fact that the vast majority of publicly funded research across the globe is published in paywall journals. That is, taxpayers pay twice for research: once for the grant to fund the work, then again to be able to read it. These paywalls mean that every potential person text-mining will have different access: some have access through their university, some may have access through their company, and others may only have access to whatever happens to be open access. On top of that, access for paywall journals often depends on your IP address - something not generally on top of mind for most people.
...One of the best things about learning R is that no matter your skill level, there is always someone who can benefit from your experience. Topics in R ranging from complicated machine learning approaches to calculating a mean all find their relevant audiences. This is particularly true when writing R packages. With an ever evolving R package development landscape (R, GitHub, external data, CRAN, continuous integration, users), there is a strong possibility that you will be taken into regions of the R world that you never knew existed. More experienced developers may not get stuck in these regions and therefore not think to shine a light on them. It is the objective of this post to explore some of those regions in the R world that were highlighted for me when the tidyhydat package was reviewed by rOpenSci....
 ZgotmplZ
 style=" object-fit: cover; object-position: center; height: 250px; width: 250px; margin-right: 15px"
/>
<p>
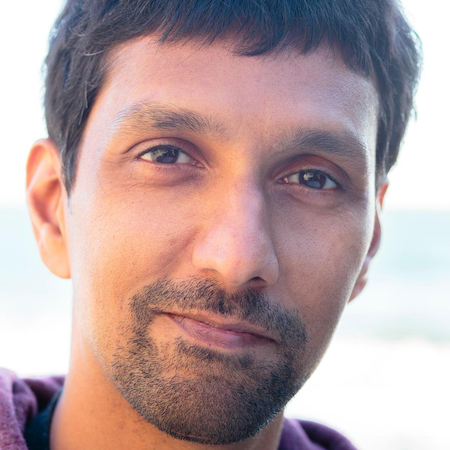
<em>Karthik Ram is a Data Scientist at the Berkeley Institute for Data Science and Berkeley Institute for Global Change Biology. He is a co-founder of rOpenSci, a collective to support the development of R-based tools which facilitate open science and access to open data. In this interview, Karthik and I discuss the birth of rOpenSci, tools and life hacks for staying sane while managing the constant stress of work fires and the importance of saying no.</em>
</p>
Join our Community Call on Tuesday, January 30th (January 31 for our Australian friends)
Nick Golding, 2017 rOpenSci Fellow, will talk about two R packages he has developed recently. zoon aims to promote open and reproducible research in ecological modeling by helping researchers share their code in a modular way and produce reproducible research artifacts. Nick has recently been trying to bootstrap a community around this idea and says this is a much harder problem.
... ZgotmplZ
 style=" object-fit: cover; object-position: center; height: 250px; width: 250px; margin-right: 15px"
/>
<p>
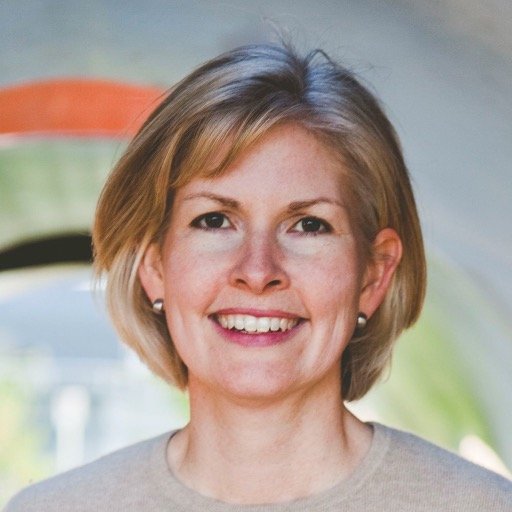
<em>Jenny Bryan @JennyBryan is a Software Engineer at RStudio and is on leave from being an Associate Professor at the University of British Columbia. Jenny serves in leadership positions with rOpenSci and <a href="https://forwards.github.io/">Forwards</a> and as an Ordinary member of <a href="https://www.r-project.org/foundation/">The R Foundation</a>.</em>
</p>
</figure>
</div>
KO: What is your name, your title, and how many years have you worked in R?
...


Working together to push science forward
Happy rOpenSci users can be found at
