All posts (Page 94 of 129)
This week magick 1.6 appeared on CRAN. This release is a big all-round maintenance update with lots of tweaks and improvements across the package.
The NEWS file gives an overview of changes in this version. In this post we highlight some changes.
library(magick)
stopifnot(packageVersion('magick') >= 1.6)
If you are new to magick, check out the vignette for a quick introduction.
🔗
Perfect Graphics Rendering
I have fixed a few small rendering imperfections in the graphics device. The native magick graphics device image_graph() now renders identical or better quality images as the R-base bitmap devices png, jpeg, etc.
🔗
Introduction
When I was in grad school at Emory, I had a favorite desk in the library. The desk wasn’t particularly cozy or private, but what it lacked in comfort it made up for in real estate. My books and I needed room to operate. Students of the ancient world require many tools, and when jumping between commentaries, lexicons, and interlinears, additional clutter is additional “friction”, i.e., lapses in thought due to frustration. Technical solutions to this clutter exist, but the best ones are proprietary and expensive. Furthermore, they are somewhat inflexible, and you may have to shoehorn your thoughts into their framework. More friction.
...I’ve raved about the value of extending a personalized welcome to new community members and I recently shared six tips for running a successful hackathon-flavoured unconference. Building on these, I’d like to share the specific approach and (free!) tools I used to help prepare new rOpenSci community members to be productive at our unconference. My approach was inspired directly by my AAAS Community Engagement Fellowship Program (AAAS-CEFP) training. Specifically, 1) one mentor said that the most successful conference they ever ran involved having one-to-one meetings with all participants prior to the event, and 2) prior to our in-person AAAS-CEFP training, we completed an intake questionnaire that forced us to consider things like “what do you hope to get out of this” and “what do you hope to contribute”....
rOpenSci is pleased to announce a new collaboration with the Methods in Ecology and Evolution (MEE), a journal of the British Ecological Society, published by Wiley press 1. Publications destined for MEE that include the development of a scientific R package will now have the option of a joint review process whereby the R package is reviewed by rOpenSci, followed by fast-tracked review of the manuscript by MEE. Authors opting for this process will be recognized via a mark on both web and print versions of their paper....
Are you new to version control and always running into trouble with Git? Or are you a seasoned user, haunted by the traumas of learning Git and reliving them whilst trying to teach it to others? Yeah, us too.
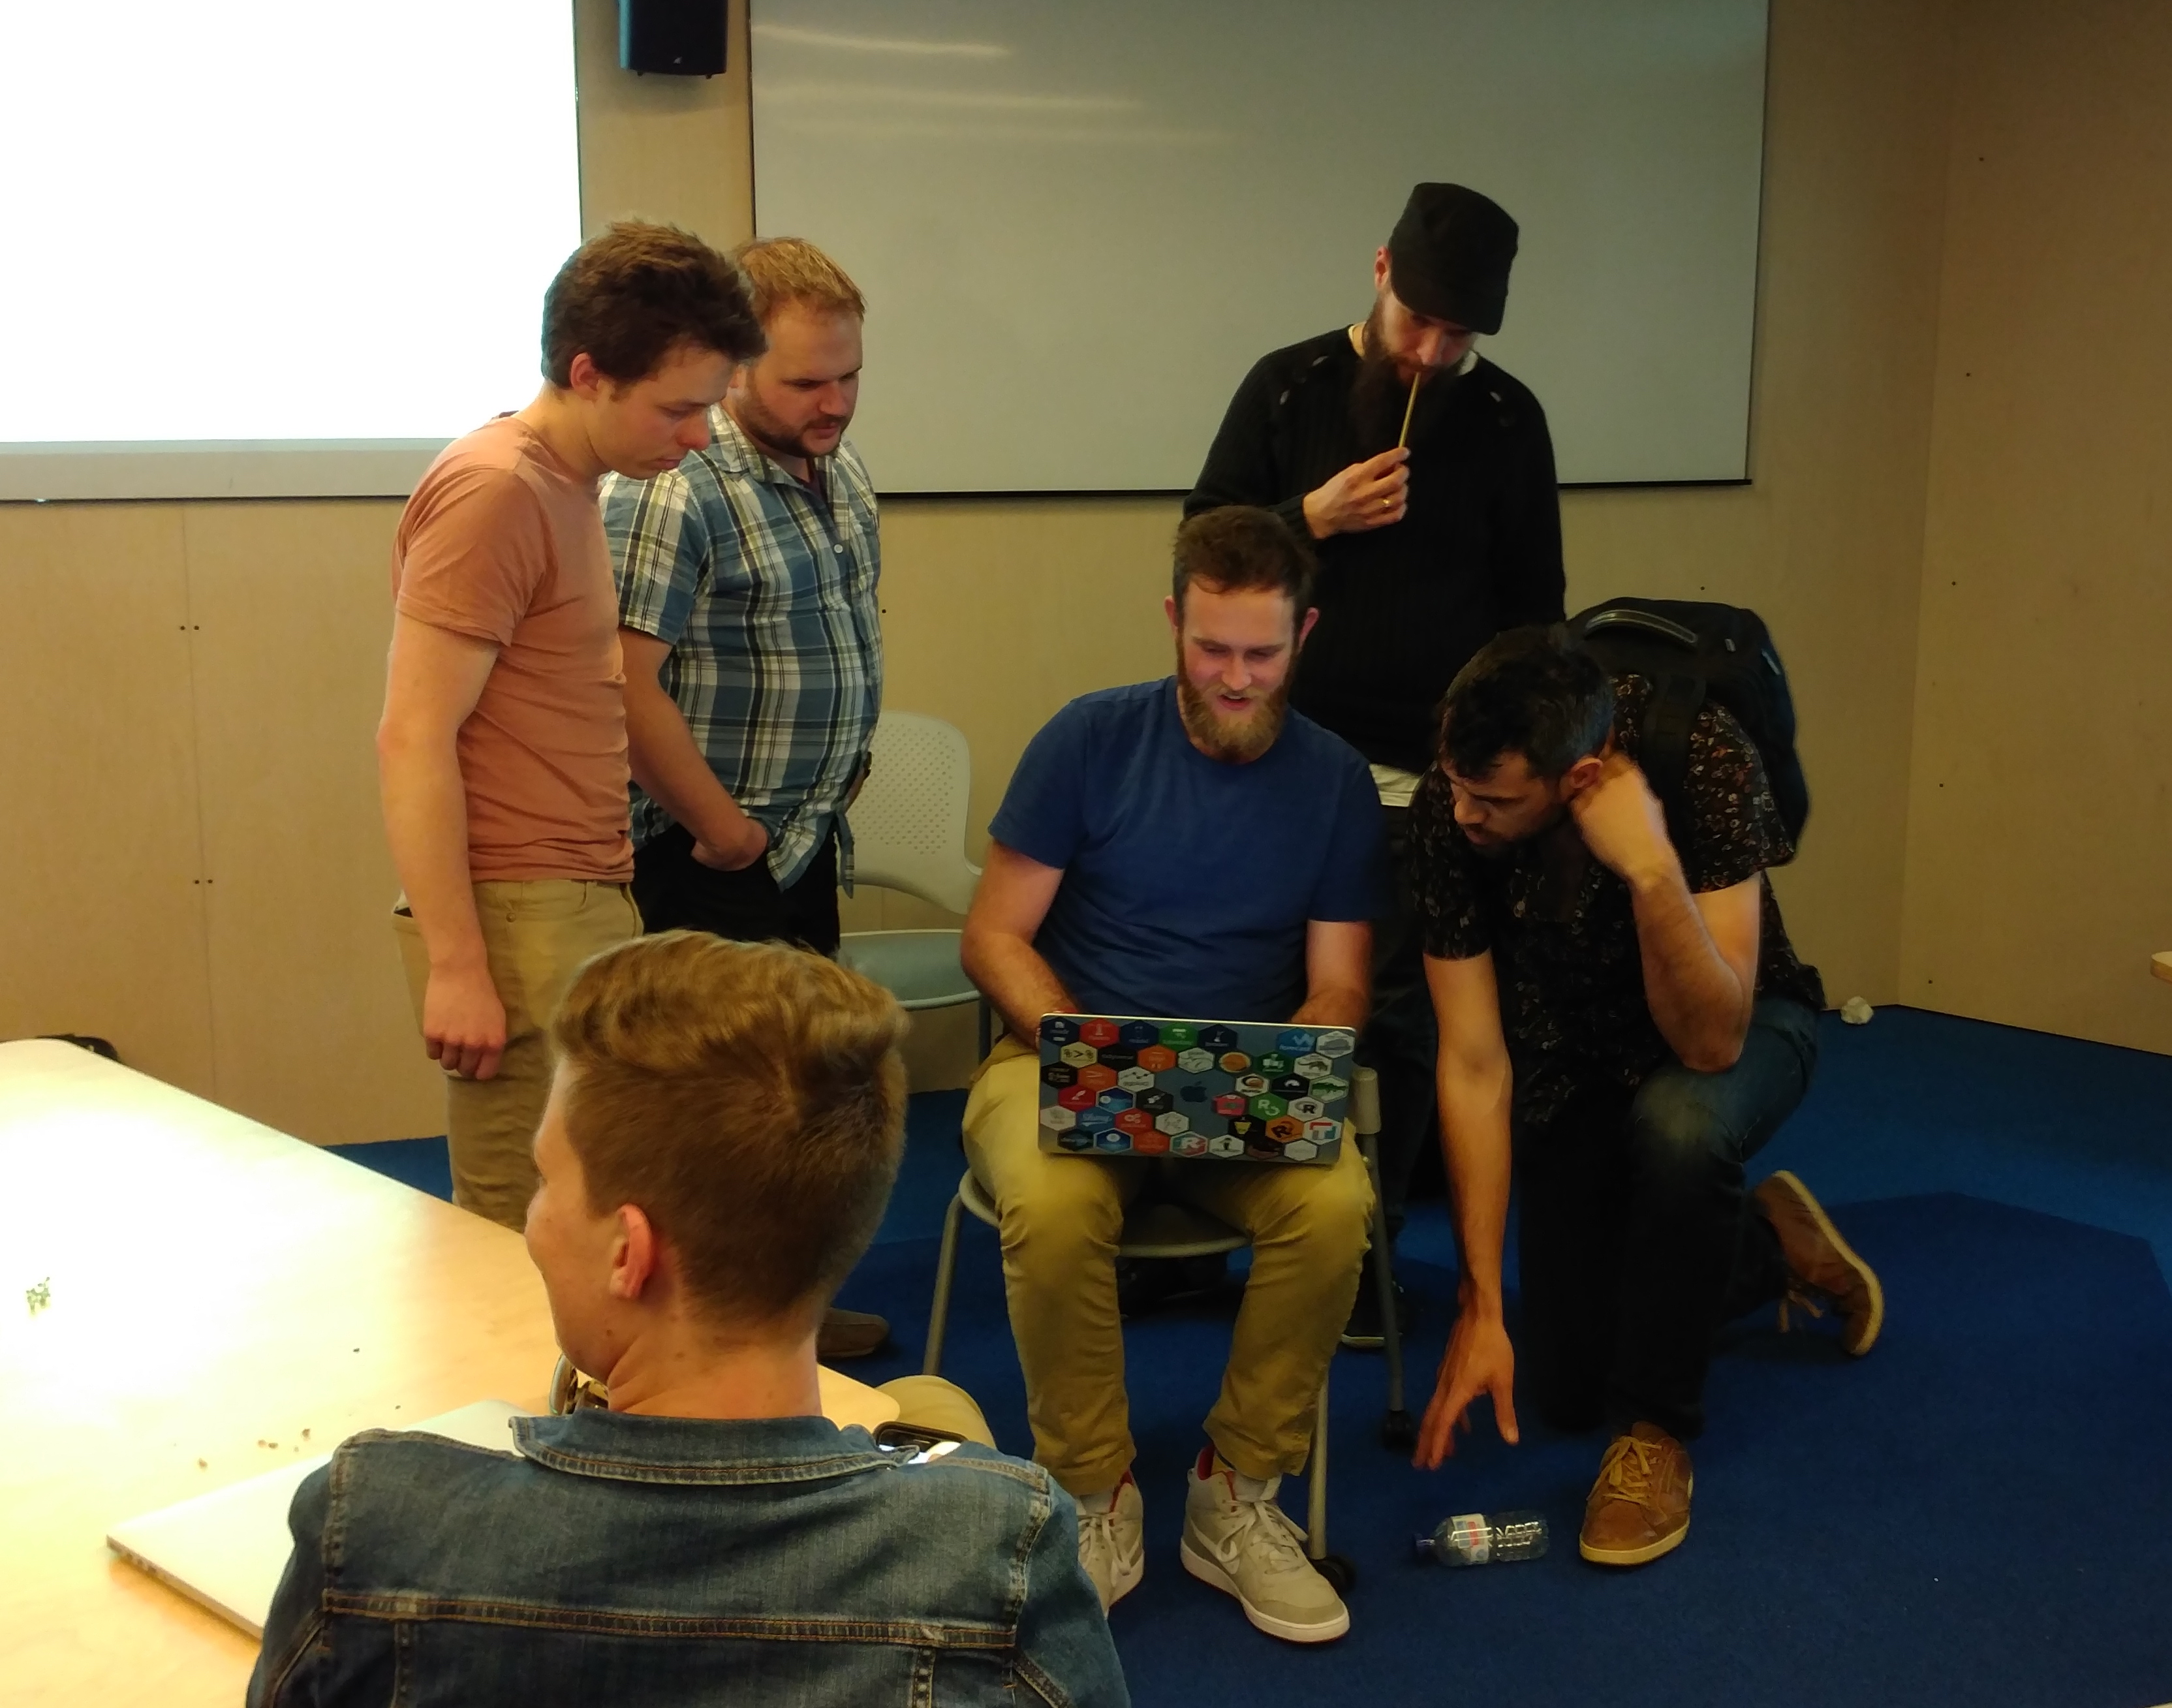
Git is a version control tool designed for software development, and it is extraordinarily powerful. It didn’t actually dawn on me quite how amazing Git is until I spent a weekend in Melbourne with a group of Git whizzes using Git to write a package targeted toward Git beginners. Whew, talk about total Git immersion! I was taking part in the 2017 rOpenSci ozunconf, in which forty-odd developers, scientists, researchers, nerds, teachers, starving students, cat ladies, and R users of all descriptions form teams to create new R packages fulfilling some new and useful function. Many of the groups used Git for their collaborative workflows all weekend.
...