
All posts (Page 95 of 129)
The second rOpenSci OzUnConf was held in Melbourne Australia a few weeks ago. A diverse range of scientists, developers and general good-eggs came together to make some R-magic happen and also learn a lot along the way. Before the conference began, a huge stack of projects were suggested on the unconf GitHub repo. For six data-visualisation enthusiasts, one issue in particular caught their eye, and the ochRe package was born.
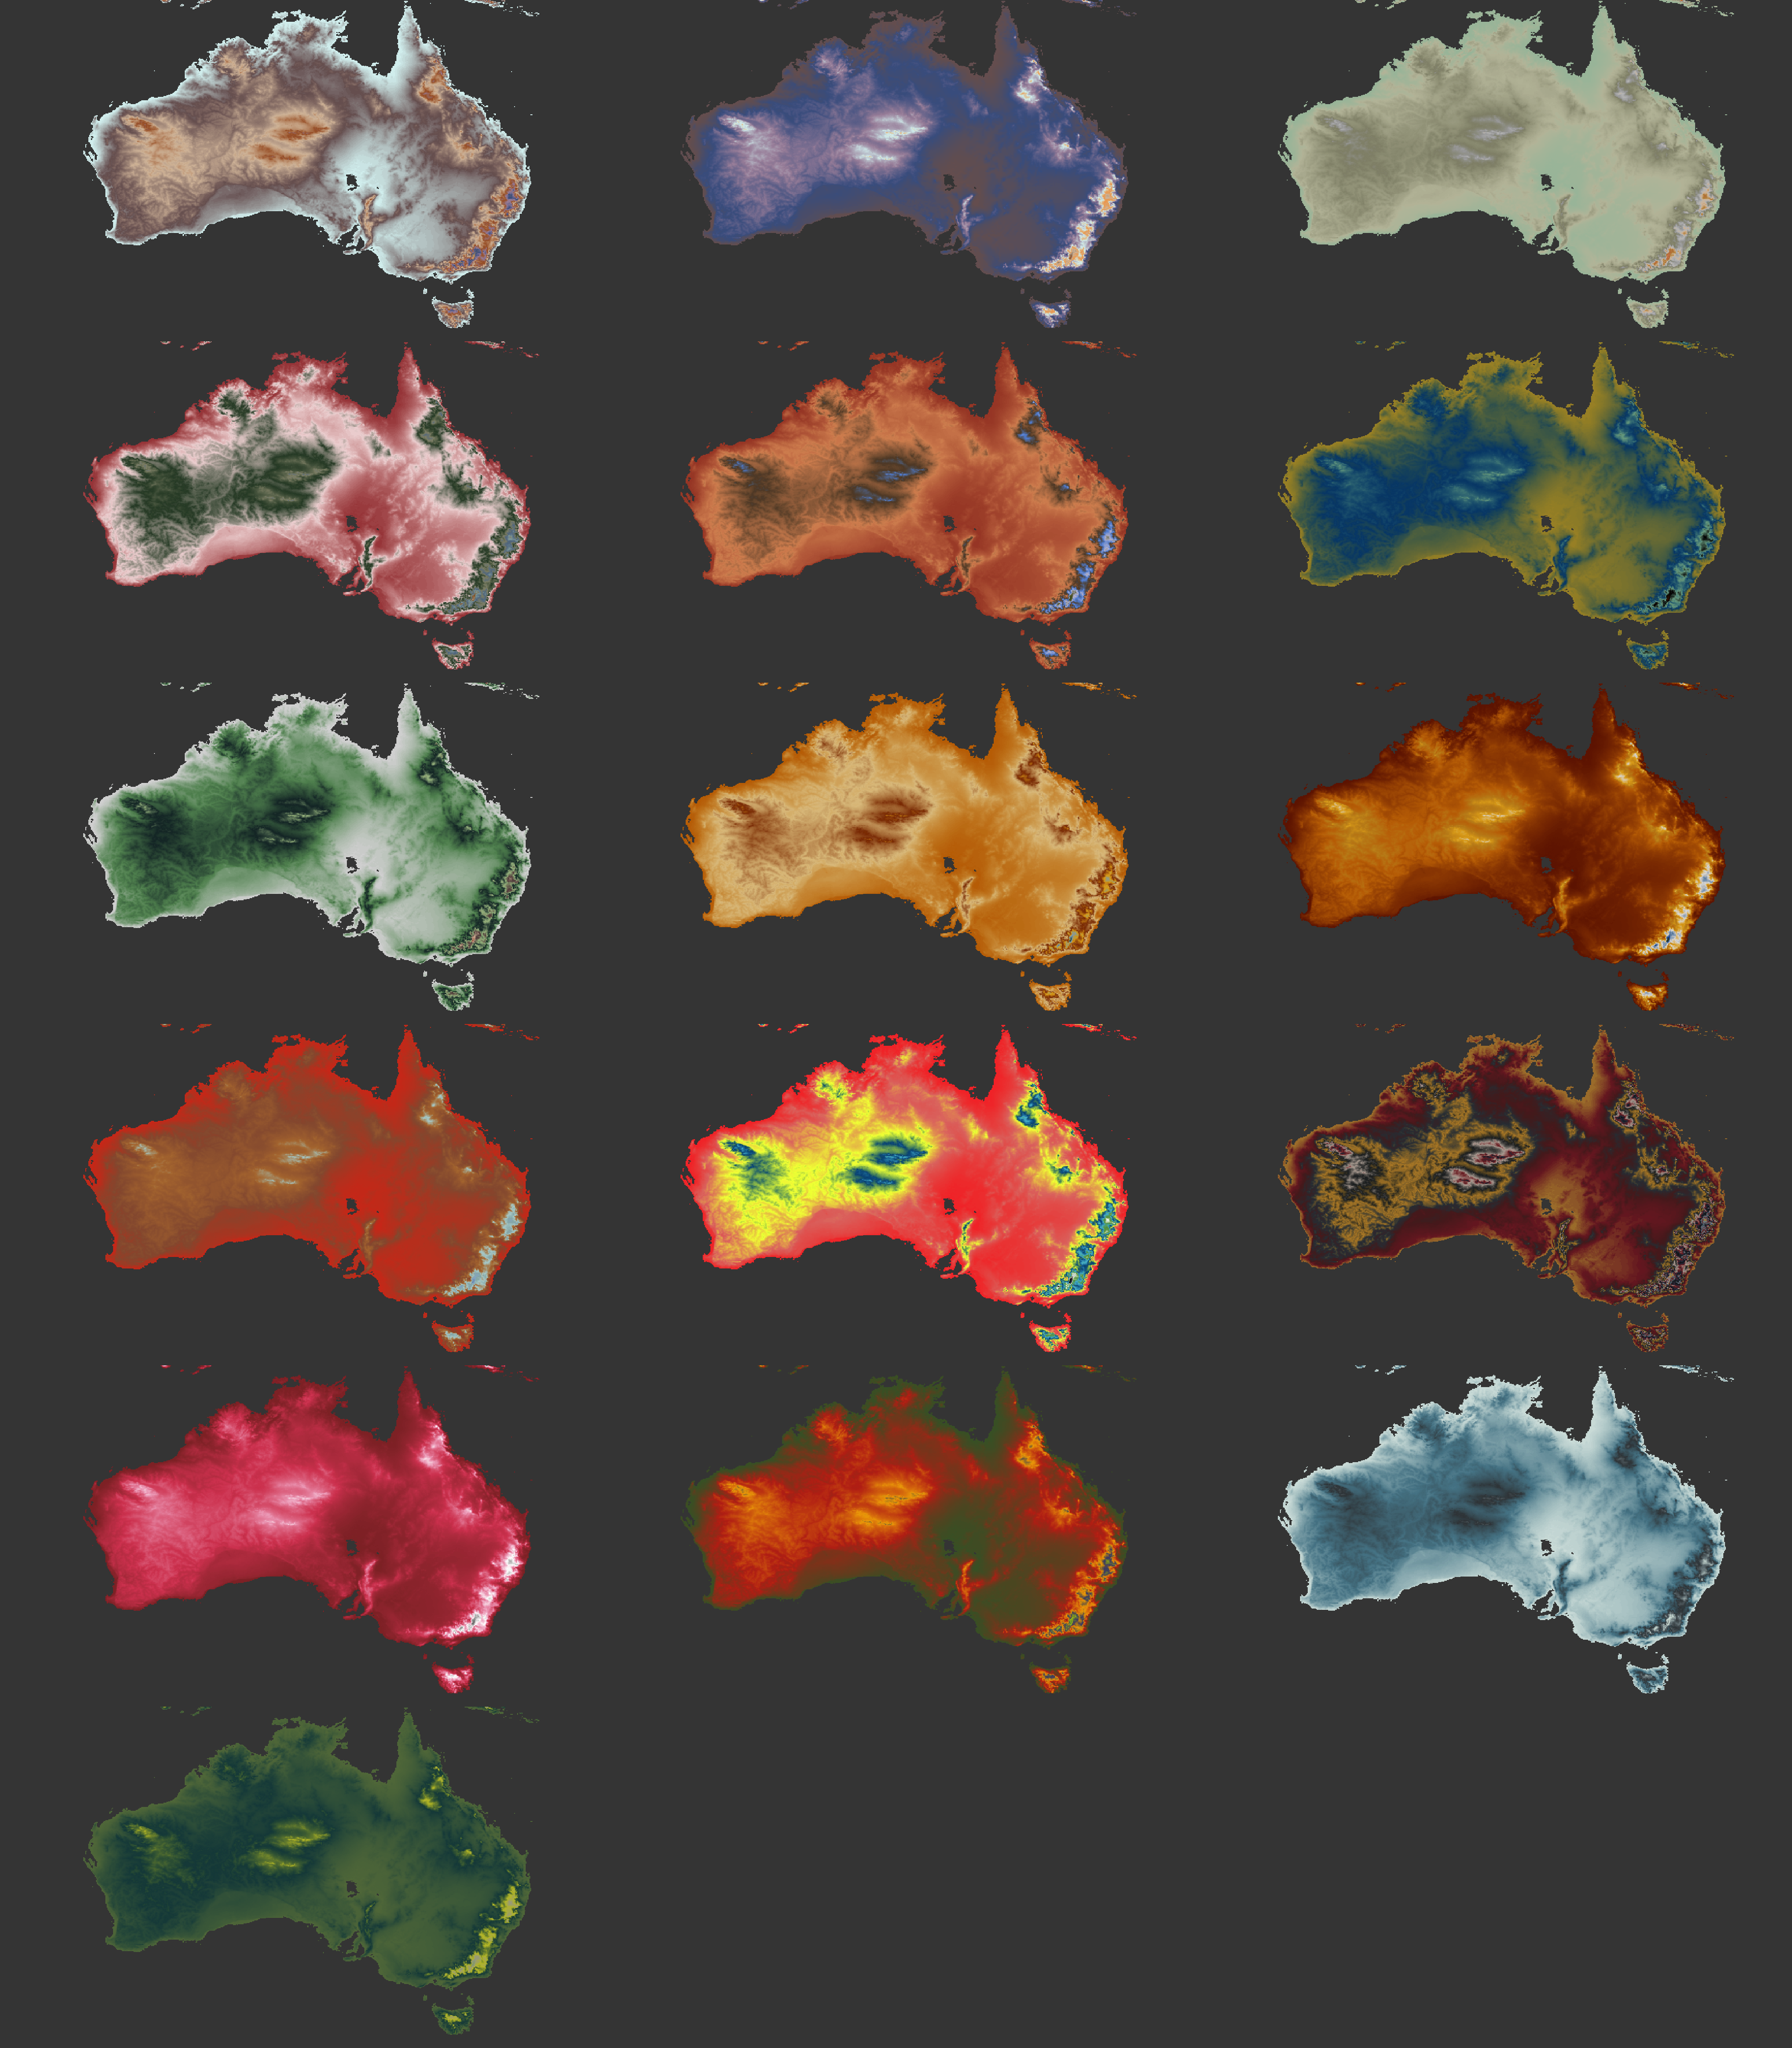
The ochRe package contains colour palettes influenced by the Australian landscape, iconic Australian artists and images. OchRe is originally the brain-child of Di Cook, who was inspired by Karthik Ram’s wesanderson package.
Attendees at the May 2017 rOpenSci unconference. Photo credit: Nistara Randhawa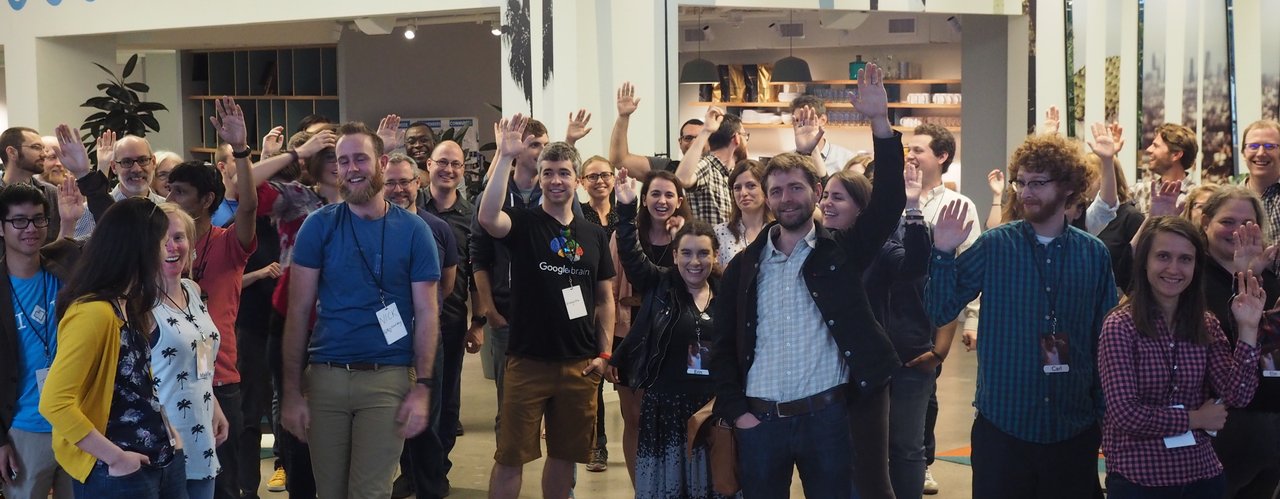
In May 2017, I helped run a wildly successful “unconference” that had a huge positive impact on the community I serve. rOpenSci is a non-profit initiative enabling open and reproducible research by creating technical infrastructure in the form of staff- and community-contributed software tools in the R programming language that lower barriers to working with scientific data sources on the web, and creating social infrastructure through a welcoming and diverse community of software users and developers. Our 4th annual unconference brought together 70 people to hack on projects they dreamed up and to give them opportunities to meet and work together in person. One third of the participants had attended before, and two thirds were first-timers, selected from an open call for applications. We paid all costs up front for anyone who requested this in order to lower barriers to participation.
...This year’s rOpenSci ozunconf was held in Melbourne, bringing together over 45 R enthusiasts from around the country and beyond. As is customary, ideas for projects were discussed in GitHub Issues (41 of them by the time the unconf rolled around!) and there was no shortage of enthusiasm, interesting concepts, and varied experience.
I’ve been to a few unconfs now and I treasure the time I get to spend with new people, new ideas, new backgrounds, new approaches, and new insights. That’s not to take away from the time I get to spend with people I met at previous unconfs; I’ve gained great friendships and started collaborations on side projects with these wonderful people.
... ZgotmplZ
 style=" object-fit: cover; object-position: center; height: 250px; width: 250px; margin-right: 15px"
/>
<p>
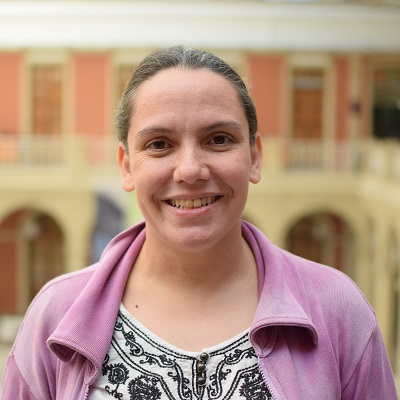
<em>Mara Averick is a non-profit data nerd, NBA stats junkie, and most recently, tidyverse developer advocate at RStudio. She is the voice behind two very popular Twitter accounts, <a href="https://twitter.com/dataandme">@dataandme</a> and <a href="https://twitter.com/batpigandme">@batpigandme</a>. Mara and I discussed sports analytics, how attending a cool conference can change the approach to your career, and how she uses Twitter as a mechanism for self-imposed forced learning.</em>
</p>
Nearly 4 years ago I wrote on this blog about an R package solr for working with the database Solr. Since then we’ve created a refresh of that package in the solrium package. Since solrium first hit CRAN about two years ago, users have raised a number of issues that required breaking changes. Thus, this blog post is about a major version bump in solrium.
🔗
What is Solr?
Solr is a “search platform” - a NoSQL database - data is organized by so called documents that are xml/json/etc blobs of text. Documents are nested within either collections or cores (depending on the mode you start Solr in). Solr makes it easy to search for documents, with a huge variety of parameters, and a number of different data formats (json/xml/csv). Solr is similar to Elasticsearch (see our Elasticsearch client elastic) - and was around before it. Solr in my opinion is harder to setup than Elasticsearch, but I don’t claim to be an expert on either.
...


Working together to push science forward
Happy rOpenSci users can be found at
